sidebarDepth: 3
sidebar: auto
Styling with cycler
Demo of custom property-cycle settings to control colors and other style properties for multi-line plots.
::: tip Note
More complete documentation of the cycler API can be found
here.
:::
This example demonstrates two different APIs:
- Setting the default rc parameter specifying the property cycle. This affects all subsequent axes (but not axes already created).
- Setting the property cycle for a single pair of axes.
from cycler import cyclerimport numpy as npimport matplotlib.pyplot as plt
First we’ll generate some sample data, in this case, four offset sine curves.
x = np.linspace(0, 2 * np.pi, 50)offsets = np.linspace(0, 2 * np.pi, 4, endpoint=False)yy = np.transpose([np.sin(x + phi) for phi in offsets])
Now yy has shape
print(yy.shape)
Out:
(50, 4)
So yy[:, i] will give you the i-th offset sine curve. Let’s set the
default prop_cycle using matplotlib.pyplot.rc(). We’ll combine a
color cycler and a linestyle cycler by adding (+) two cycler‘s
together. See the bottom of this tutorial for more information about
combining different cyclers.
default_cycler = (cycler(color=['r', 'g', 'b', 'y']) +cycler(linestyle=['-', '--', ':', '-.']))plt.rc('lines', linewidth=4)plt.rc('axes', prop_cycle=default_cycler)
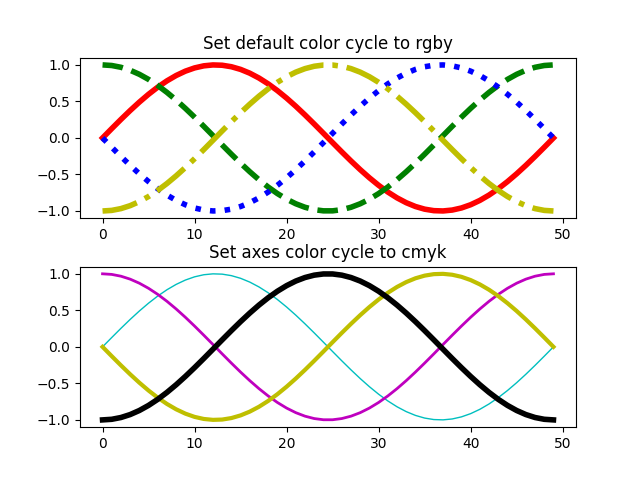
Now we’ll generate a figure with two axes, one on top of the other. On the
first axis, we’ll plot with the default cycler. On the second axis, we’ll
set the prop_cycle using matplotlib.axes.Axes.set_prop_cycle(),
which will only set the prop_cycle for this matplotlib.axes.Axes
instance. We’ll use a second cycler that combines a color cycler and a
linewidth cycler.
custom_cycler = (cycler(color=['c', 'm', 'y', 'k']) +cycler(lw=[1, 2, 3, 4]))fig, (ax0, ax1) = plt.subplots(nrows=2)ax0.plot(yy)ax0.set_title('Set default color cycle to rgby')ax1.set_prop_cycle(custom_cycler)ax1.plot(yy)ax1.set_title('Set axes color cycle to cmyk')# Add a bit more space between the two plots.fig.subplots_adjust(hspace=0.3)plt.show()
Setting prop_cycle in the matplotlibrc file or style files
Remember, if you want to set a custom cycler in your
.matplotlibrc file or a style file (style.mplstyle), you can set the
axes.prop_cycle property:
axes.prop_cycle : cycler(color='bgrcmyk')
Cycling through multiple properties
You can add cyclers:
from cycler import cyclercc = (cycler(color=list('rgb')) +cycler(linestyle=['-', '--', '-.']))for d in cc:print(d)
Results in:
{'color': 'r', 'linestyle': '-'}{'color': 'g', 'linestyle': '--'}{'color': 'b', 'linestyle': '-.'}
You can multiply cyclers:
from cycler import cyclercc = (cycler(color=list('rgb')) *cycler(linestyle=['-', '--', '-.']))for d in cc:print(d)
Results in:
{'color': 'r', 'linestyle': '-'}{'color': 'r', 'linestyle': '--'}{'color': 'r', 'linestyle': '-.'}{'color': 'g', 'linestyle': '-'}{'color': 'g', 'linestyle': '--'}{'color': 'g', 'linestyle': '-.'}{'color': 'b', 'linestyle': '-'}{'color': 'b', 'linestyle': '--'}{'color': 'b', 'linestyle': '-.'}
Download

若有收获,就点个赞吧
0 人点赞
