渐变条形图
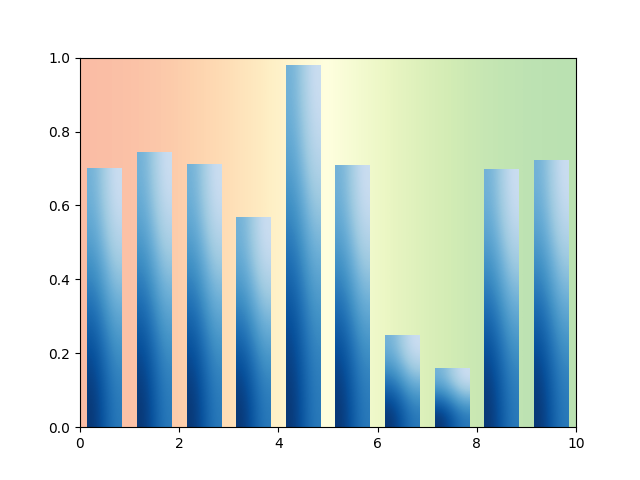
import matplotlib.pyplot as pltimport numpy as npnp.random.seed(19680801)def gbar(ax, x, y, width=0.5, bottom=0):X = [[.6, .6], [.7, .7]]for left, top in zip(x, y):right = left + widthax.imshow(X, interpolation='bicubic', cmap=plt.cm.Blues,extent=(left, right, bottom, top), alpha=1)xmin, xmax = xlim = 0, 10ymin, ymax = ylim = 0, 1fig, ax = plt.subplots()ax.set(xlim=xlim, ylim=ylim, autoscale_on=False)X = [[.6, .6], [.7, .7]]ax.imshow(X, interpolation='bicubic', cmap=plt.cm.copper,extent=(xmin, xmax, ymin, ymax), alpha=1)N = 10x = np.arange(N) + 0.25y = np.random.rand(N)gbar(ax, x, y, width=0.7)ax.set_aspect('auto')plt.show()
下载这个示例

若有收获,就点个赞吧
0 人点赞
