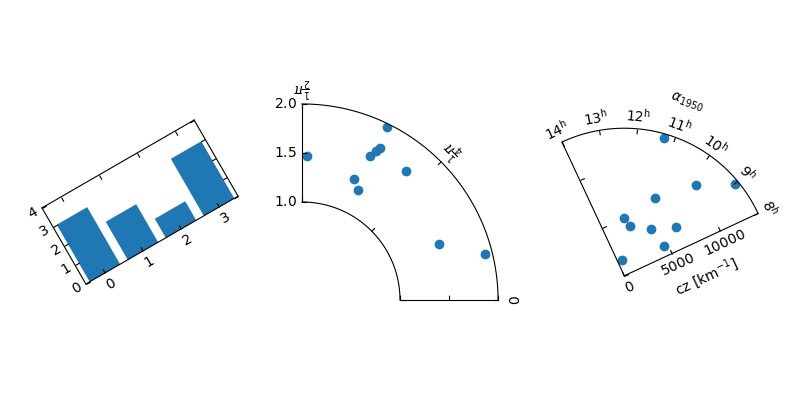
演示浮动轴
浮动轴的演示。
from matplotlib.transforms import Affine2Dimport mpl_toolkits.axisartist.floating_axes as floating_axesimport numpy as npimport mpl_toolkits.axisartist.angle_helper as angle_helperfrom matplotlib.projections import PolarAxesfrom mpl_toolkits.axisartist.grid_finder import (FixedLocator, MaxNLocator,DictFormatter)import matplotlib.pyplot as plt# Fixing random state for reproducibilitynp.random.seed(19680801)def setup_axes1(fig, rect):"""A simple one."""tr = Affine2D().scale(2, 1).rotate_deg(30)grid_helper = floating_axes.GridHelperCurveLinear(tr, extremes=(-0.5, 3.5, 0, 4))ax1 = floating_axes.FloatingSubplot(fig, rect, grid_helper=grid_helper)fig.add_subplot(ax1)aux_ax = ax1.get_aux_axes(tr)grid_helper.grid_finder.grid_locator1._nbins = 4grid_helper.grid_finder.grid_locator2._nbins = 4return ax1, aux_axdef setup_axes2(fig, rect):"""With custom locator and formatter.Note that the extreme values are swapped."""tr = PolarAxes.PolarTransform()pi = np.piangle_ticks = [(0, r"$0$"),(.25*pi, r"$\frac{1}{4}\pi$"),(.5*pi, r"$\frac{1}{2}\pi$")]grid_locator1 = FixedLocator([v for v, s in angle_ticks])tick_formatter1 = DictFormatter(dict(angle_ticks))grid_locator2 = MaxNLocator(2)grid_helper = floating_axes.GridHelperCurveLinear(tr, extremes=(.5*pi, 0, 2, 1),grid_locator1=grid_locator1,grid_locator2=grid_locator2,tick_formatter1=tick_formatter1,tick_formatter2=None)ax1 = floating_axes.FloatingSubplot(fig, rect, grid_helper=grid_helper)fig.add_subplot(ax1)# create a parasite axes whose transData in RA, czaux_ax = ax1.get_aux_axes(tr)aux_ax.patch = ax1.patch # for aux_ax to have a clip path as in axax1.patch.zorder = 0.9 # but this has a side effect that the patch is# drawn twice, and possibly over some other# artists. So, we decrease the zorder a bit to# prevent this.return ax1, aux_axdef setup_axes3(fig, rect):"""Sometimes, things like axis_direction need to be adjusted."""# rotate a bit for better orientationtr_rotate = Affine2D().translate(-95, 0)# scale degree to radianstr_scale = Affine2D().scale(np.pi/180., 1.)tr = tr_rotate + tr_scale + PolarAxes.PolarTransform()grid_locator1 = angle_helper.LocatorHMS(4)tick_formatter1 = angle_helper.FormatterHMS()grid_locator2 = MaxNLocator(3)# Specify theta limits in degreesra0, ra1 = 8.*15, 14.*15# Specify radial limitscz0, cz1 = 0, 14000grid_helper = floating_axes.GridHelperCurveLinear(tr, extremes=(ra0, ra1, cz0, cz1),grid_locator1=grid_locator1,grid_locator2=grid_locator2,tick_formatter1=tick_formatter1,tick_formatter2=None)ax1 = floating_axes.FloatingSubplot(fig, rect, grid_helper=grid_helper)fig.add_subplot(ax1)# adjust axisax1.axis["left"].set_axis_direction("bottom")ax1.axis["right"].set_axis_direction("top")ax1.axis["bottom"].set_visible(False)ax1.axis["top"].set_axis_direction("bottom")ax1.axis["top"].toggle(ticklabels=True, label=True)ax1.axis["top"].major_ticklabels.set_axis_direction("top")ax1.axis["top"].label.set_axis_direction("top")ax1.axis["left"].label.set_text(r"cz [km$^{-1}$]")ax1.axis["top"].label.set_text(r"$\alpha_{1950}$")# create a parasite axes whose transData in RA, czaux_ax = ax1.get_aux_axes(tr)aux_ax.patch = ax1.patch # for aux_ax to have a clip path as in axax1.patch.zorder = 0.9 # but this has a side effect that the patch is# drawn twice, and possibly over some other# artists. So, we decrease the zorder a bit to# prevent this.return ax1, aux_ax
fig = plt.figure(1, figsize=(8, 4))fig.subplots_adjust(wspace=0.3, left=0.05, right=0.95)ax1, aux_ax1 = setup_axes1(fig, 131)aux_ax1.bar([0, 1, 2, 3], [3, 2, 1, 3])ax2, aux_ax2 = setup_axes2(fig, 132)theta = np.random.rand(10)*.5*np.piradius = np.random.rand(10) + 1.aux_ax2.scatter(theta, radius)ax3, aux_ax3 = setup_axes3(fig, 133)theta = (8 + np.random.rand(10)*(14 - 8))*15. # in degreesradius = np.random.rand(10)*14000.aux_ax3.scatter(theta, radius)plt.show()
下载这个示例

若有收获,就点个赞吧
0 人点赞
