Axes.margins缩放粘性
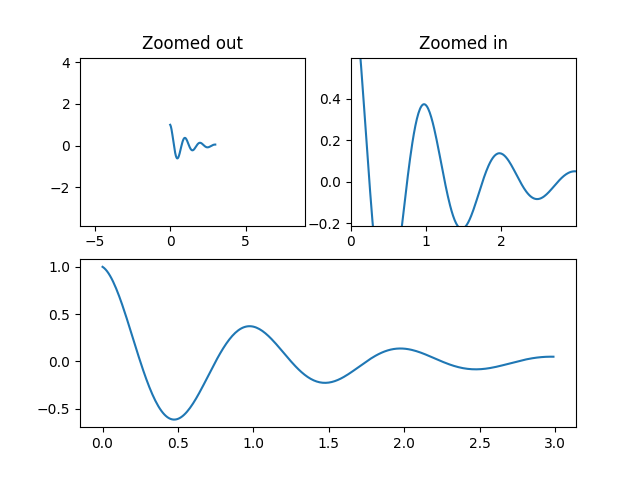
此示例中的第一个图显示了如何使用边距)而不是set_xlim和set_ylim放大和缩小绘图。第二个图展示了某些方法和艺术家引入的边缘“粘性”的概念,以及如何有效地解决这个问题。
import numpy as npimport matplotlib.pyplot as pltdef f(t):return np.exp(-t) * np.cos(2*np.pi*t)t1 = np.arange(0.0, 3.0, 0.01)ax1 = plt.subplot(212)ax1.margins(0.05) # Default margin is 0.05, value 0 means fitax1.plot(t1, f(t1), 'k')ax2 = plt.subplot(221)ax2.margins(2, 2) # Values >0.0 zoom outax2.plot(t1, f(t1), 'r')ax2.set_title('Zoomed out')ax3 = plt.subplot(222)ax3.margins(x=0, y=-0.25) # Values in (-0.5, 0.0) zooms in to centerax3.plot(t1, f(t1), 'g')ax3.set_title('Zoomed in')plt.show()
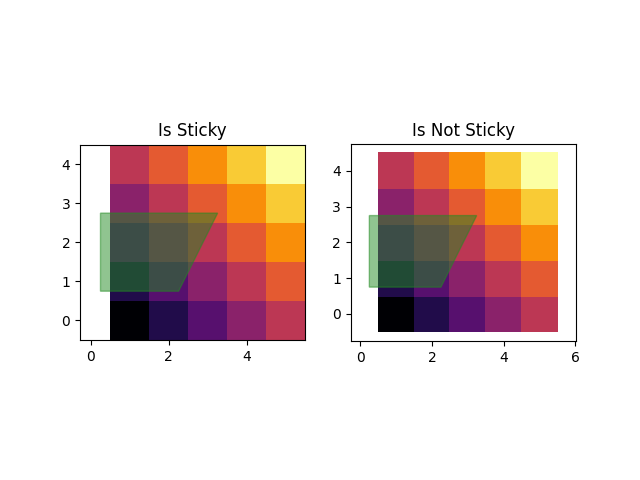
论某些绘图方法的“粘性”
一些绘图功能使轴限制为 “粘性(stickiness)” 或不受边距方法的影响。 例如,imshow 和pcolor期望用户希望限制在图中所示的像素周围紧密。 如果不需要此行为,则需要将 use_sticky_edges 设置为 False。请考虑以下示例:
一些绘图功能使轴限制“粘性(stickiness)”或免疫的边缘方法。例如,imShow和pcold期望用户希望限制紧在绘图中所示的像素周围。如果不需要此行为,则需要将use_clatice_edage设置为false。考虑以下示例:
y, x = np.mgrid[:5, 1:6]poly_coords = [(0.25, 2.75), (3.25, 2.75),(2.25, 0.75), (0.25, 0.75)]fig, (ax1, ax2) = plt.subplots(ncols=2)# Here we set the stickiness of the axes object...# ax1 we'll leave as the default, which uses sticky edges# and we'll turn off stickiness for ax2ax2.use_sticky_edges = Falsefor ax, status in zip((ax1, ax2), ('Is', 'Is Not')):cells = ax.pcolor(x, y, x+y, cmap='inferno') # stickyax.add_patch(plt.Polygon(poly_coords, color='forestgreen', alpha=0.5)) # not stickyax.margins(x=0.1, y=0.05)ax.set_aspect('equal')ax.set_title('{} Sticky'.format(status))plt.show()
参考
本例中显示了以下函数、方法的使用:
import matplotlibmatplotlib.axes.Axes.marginsmatplotlib.pyplot.marginsmatplotlib.axes.Axes.use_sticky_edgesmatplotlib.axes.Axes.pcolormatplotlib.pyplot.pcolormatplotlib.pyplot.Polygon
下载这个示例

若有收获,就点个赞吧
0 人点赞
