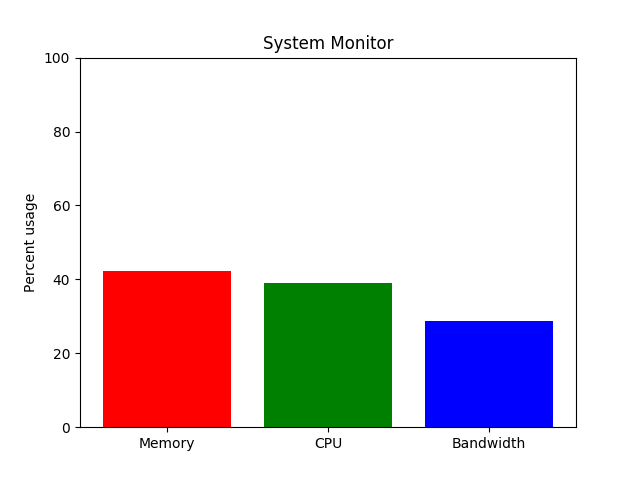
系统监视器
输出:
75.0 frames per second
import timeimport matplotlib.pyplot as pltimport numpy as npdef get_memory(t):"Simulate a function that returns system memory"return 100 * (0.5 + 0.5 * np.sin(0.5 * np.pi * t))def get_cpu(t):"Simulate a function that returns cpu usage"return 100 * (0.5 + 0.5 * np.sin(0.2 * np.pi * (t - 0.25)))def get_net(t):"Simulate a function that returns network bandwidth"return 100 * (0.5 + 0.5 * np.sin(0.7 * np.pi * (t - 0.1)))def get_stats(t):return get_memory(t), get_cpu(t), get_net(t)fig, ax = plt.subplots()ind = np.arange(1, 4)# show the figure, but do not blockplt.show(block=False)pm, pc, pn = plt.bar(ind, get_stats(0))pm.set_facecolor('r')pc.set_facecolor('g')pn.set_facecolor('b')ax.set_xticks(ind)ax.set_xticklabels(['Memory', 'CPU', 'Bandwidth'])ax.set_ylim([0, 100])ax.set_ylabel('Percent usage')ax.set_title('System Monitor')start = time.time()for i in range(200): # run for a little whilem, c, n = get_stats(i / 10.0)# update the animated artistspm.set_height(m)pc.set_height(c)pn.set_height(n)# ask the canvas to re-draw itself the next time it# has a chance.# For most of the GUI backends this adds an event to the queue# of the GUI frameworks event loop.fig.canvas.draw_idle()try:# make sure that the GUI framework has a chance to run its event loop# and clear any GUI events. This needs to be in a try/except block# because the default implementation of this method is to raise# NotImplementedErrorfig.canvas.flush_events()except NotImplementedError:passstop = time.time()print("{fps:.1f} frames per second".format(fps=200 / (stop - start)))
脚本的总运行时间:(0分钟2.678秒)
下载这个示例

若有收获,就点个赞吧
0 人点赞
