基本子图演示
演示有两个子图。有关更多选项,请参阅子图演示。
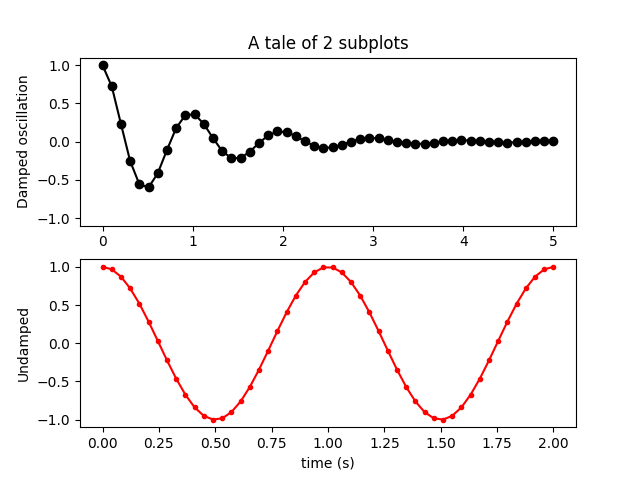
import numpy as npimport matplotlib.pyplot as plt# Data for plottingx1 = np.linspace(0.0, 5.0)x2 = np.linspace(0.0, 2.0)y1 = np.cos(2 * np.pi * x1) * np.exp(-x1)y2 = np.cos(2 * np.pi * x2)# Create two subplots sharing y axisfig, (ax1, ax2) = plt.subplots(2, sharey=True)ax1.plot(x1, y1, 'ko-')ax1.set(title='A tale of 2 subplots', ylabel='Damped oscillation')ax2.plot(x2, y2, 'r.-')ax2.set(xlabel='time (s)', ylabel='Undamped')plt.show()
下载这个示例

若有收获,就点个赞吧
0 人点赞
