简单的轴线网格2
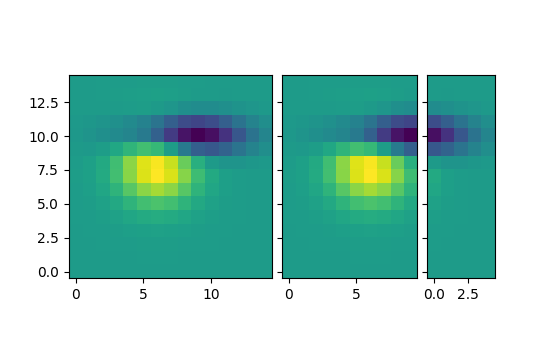
import matplotlib.pyplot as pltfrom mpl_toolkits.axes_grid1 import ImageGriddef get_demo_image():import numpy as npfrom matplotlib.cbook import get_sample_dataf = get_sample_data("axes_grid/bivariate_normal.npy", asfileobj=False)z = np.load(f)# z is a numpy array of 15x15return z, (-3, 4, -4, 3)F = plt.figure(1, (5.5, 3.5))grid = ImageGrid(F, 111, # similar to subplot(111)nrows_ncols=(1, 3),axes_pad=0.1,add_all=True,label_mode="L",)Z, extent = get_demo_image() # demo imageim1 = Zim2 = Z[:, :10]im3 = Z[:, 10:]vmin, vmax = Z.min(), Z.max()for i, im in enumerate([im1, im2, im3]):ax = grid[i]ax.imshow(im, origin="lower", vmin=vmin,vmax=vmax, interpolation="nearest")plt.show()
下载这个示例

若有收获,就点个赞吧
0 人点赞
