Pyplot 文本(Text)
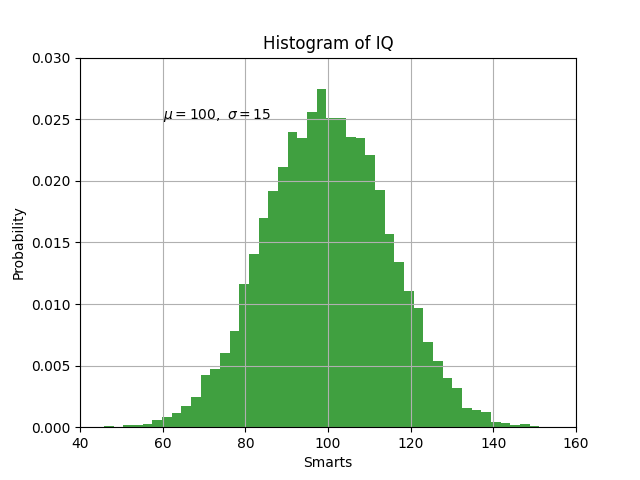
import numpy as npimport matplotlib.pyplot as plt# Fixing random state for reproducibilitynp.random.seed(19680801)mu, sigma = 100, 15x = mu + sigma * np.random.randn(10000)# the histogram of the datan, bins, patches = plt.hist(x, 50, density=True, facecolor='g', alpha=0.75)plt.xlabel('Smarts')plt.ylabel('Probability')plt.title('Histogram of IQ')plt.text(60, .025, r'$\mu=100,\ \sigma=15$')plt.axis([40, 160, 0, 0.03])plt.grid(True)plt.show()
参考
此示例显示了以下函数、方法、类和模块的使用:
import matplotlibmatplotlib.pyplot.histmatplotlib.pyplot.xlabelmatplotlib.pyplot.ylabelmatplotlib.pyplot.textmatplotlib.pyplot.gridmatplotlib.pyplot.show
下载这个示例

若有收获,就点个赞吧
0 人点赞
