PathPatch对象
此示例显示如何通过Matplotlib的API创建 Path 和 PathPatch 对象。
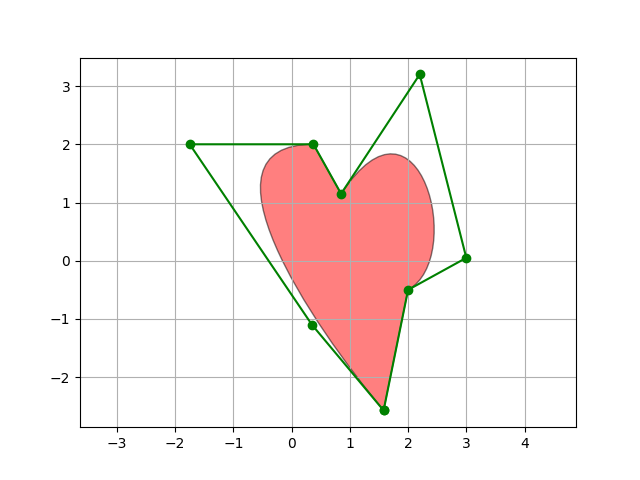
import matplotlib.path as mpathimport matplotlib.patches as mpatchesimport matplotlib.pyplot as pltfig, ax = plt.subplots()Path = mpath.Pathpath_data = [(Path.MOVETO, (1.58, -2.57)),(Path.CURVE4, (0.35, -1.1)),(Path.CURVE4, (-1.75, 2.0)),(Path.CURVE4, (0.375, 2.0)),(Path.LINETO, (0.85, 1.15)),(Path.CURVE4, (2.2, 3.2)),(Path.CURVE4, (3, 0.05)),(Path.CURVE4, (2.0, -0.5)),(Path.CLOSEPOLY, (1.58, -2.57)),]codes, verts = zip(*path_data)path = mpath.Path(verts, codes)patch = mpatches.PathPatch(path, facecolor='r', alpha=0.5)ax.add_patch(patch)# plot control points and connecting linesx, y = zip(*path.vertices)line, = ax.plot(x, y, 'go-')ax.grid()ax.axis('equal')plt.show()
参考
此示例中显示了以下函数,方法,类和模块的使用:
import matplotlibmatplotlib.pathmatplotlib.path.Pathmatplotlib.patchesmatplotlib.patches.PathPatchmatplotlib.axes.Axes.add_patch
下载这个示例

若有收获,就点个赞吧
0 人点赞
