交叉和自动关联演示
使用互相关(xcorr)和自相关(acorr)图的示例。
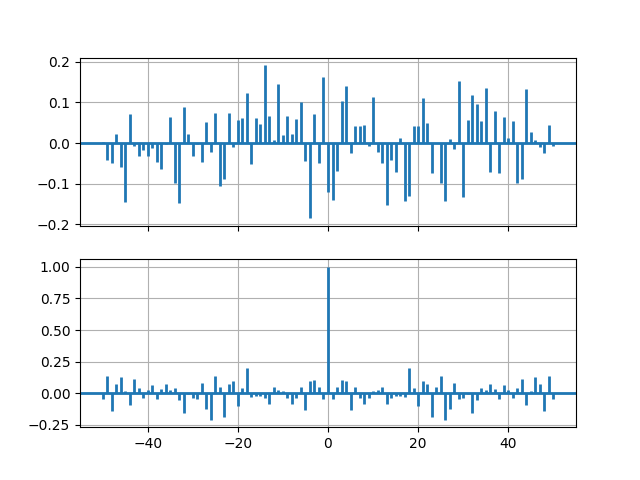
import matplotlib.pyplot as pltimport numpy as np# Fixing random state for reproducibilitynp.random.seed(19680801)x, y = np.random.randn(2, 100)fig, [ax1, ax2] = plt.subplots(2, 1, sharex=True)ax1.xcorr(x, y, usevlines=True, maxlags=50, normed=True, lw=2)ax1.grid(True)ax1.axhline(0, color='black', lw=2)ax2.acorr(x, usevlines=True, normed=True, maxlags=50, lw=2)ax2.grid(True)ax2.axhline(0, color='black', lw=2)plt.show()
下载这个示例

若有收获,就点个赞吧
0 人点赞
