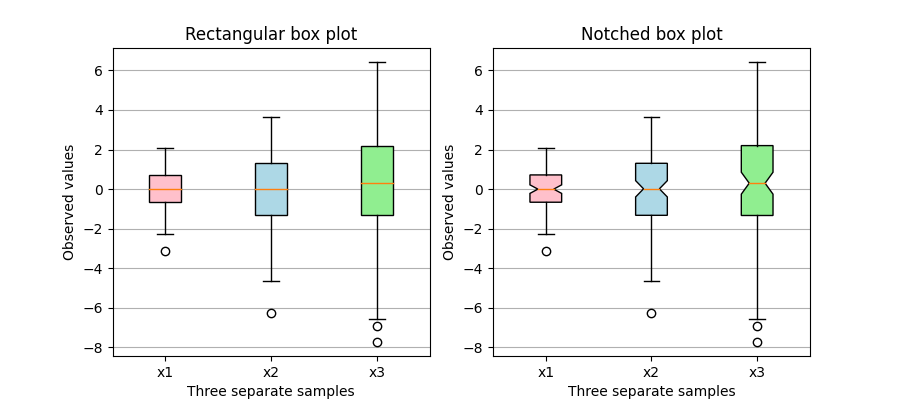
带有自定义填充颜色的箱形图
此图说明了如何创建两种类型的箱形图(矩形和缺口),以及如何通过访问框图的艺术家属性来使用自定义颜色填充它们。 此外,labels参数用于为每个样本提供x-tick标签。
关于箱形图及其历史的一般参考可以在这里找到:http://vita.had.co.nz/papers/boxplots.pdf
import matplotlib.pyplot as pltimport numpy as np# Random test datanp.random.seed(19680801)all_data = [np.random.normal(0, std, size=100) for std in range(1, 4)]labels = ['x1', 'x2', 'x3']fig, axes = plt.subplots(nrows=1, ncols=2, figsize=(9, 4))# rectangular box plotbplot1 = axes[0].boxplot(all_data,vert=True, # vertical box alignmentpatch_artist=True, # fill with colorlabels=labels) # will be used to label x-ticksaxes[0].set_title('Rectangular box plot')# notch shape box plotbplot2 = axes[1].boxplot(all_data,notch=True, # notch shapevert=True, # vertical box alignmentpatch_artist=True, # fill with colorlabels=labels) # will be used to label x-ticksaxes[1].set_title('Notched box plot')# fill with colorscolors = ['pink', 'lightblue', 'lightgreen']for bplot in (bplot1, bplot2):for patch, color in zip(bplot['boxes'], colors):patch.set_facecolor(color)# adding horizontal grid linesfor ax in axes:ax.yaxis.grid(True)ax.set_xlabel('Three separate samples')ax.set_ylabel('Observed values')plt.show()
下载这个示例

若有收获,就点个赞吧
0 人点赞
