极轴上的散点图
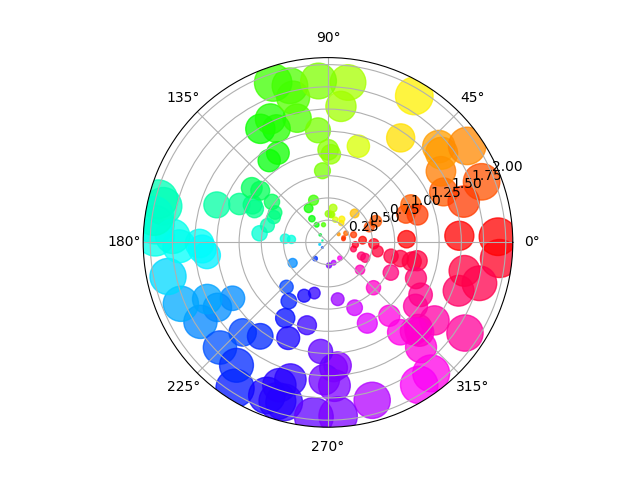
在这个例子中,尺寸径向增加,颜色随角度增加(只是为了验证符号是否正确分散)。
import numpy as npimport matplotlib.pyplot as plt# Fixing random state for reproducibilitynp.random.seed(19680801)# Compute areas and colorsN = 150r = 2 * np.random.rand(N)theta = 2 * np.pi * np.random.rand(N)area = 200 * r**2colors = thetafig = plt.figure()ax = fig.add_subplot(111, projection='polar')c = ax.scatter(theta, r, c=colors, s=area, cmap='hsv', alpha=0.75)
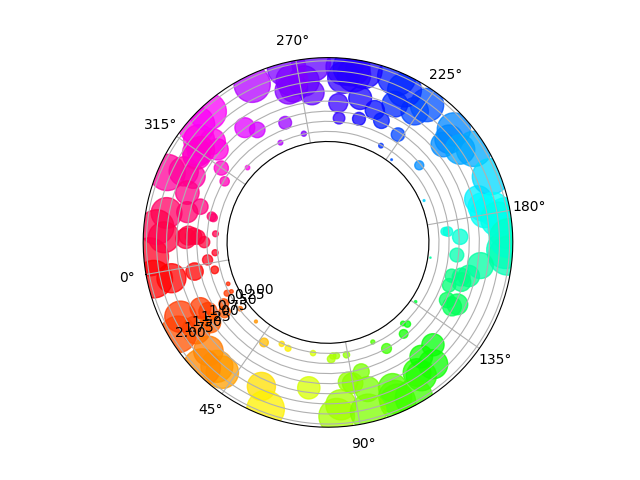
极轴上的散点图,具有偏移原点
与先前图的主要区别在于原点半径的配置,产生环。 此外,θ零位置设置为旋转图。
fig = plt.figure()ax = fig.add_subplot(111, polar=True)c = ax.scatter(theta, r, c=colors, s=area, cmap='hsv', alpha=0.75)ax.set_rorigin(-2.5)ax.set_theta_zero_location('W', offset=10)
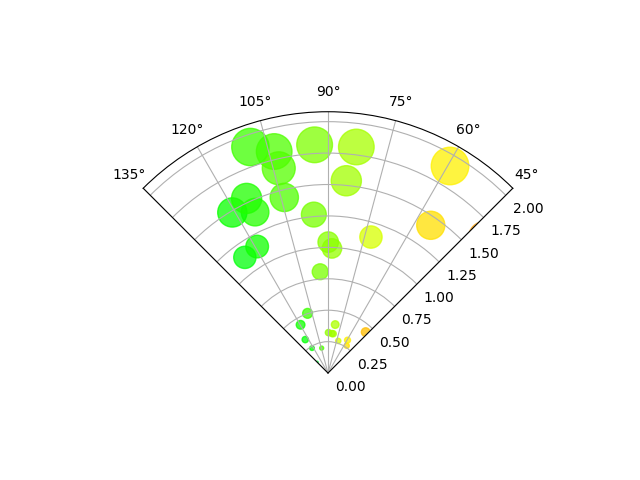
极轴上的散点图局限于扇区
与之前的图表的主要区别在于theta开始和结束限制的配置,产生扇区而不是整圆。
fig = plt.figure()ax = fig.add_subplot(111, polar=True)c = ax.scatter(theta, r, c=colors, s=area, cmap='hsv', alpha=0.75)ax.set_thetamin(45)ax.set_thetamax(135)plt.show()
参考
此示例中显示了以下函数,方法,类和模块的使用:
import matplotlibmatplotlib.axes.Axes.scattermatplotlib.pyplot.scattermatplotlib.projections.polarmatplotlib.projections.polar.PolarAxes.set_roriginmatplotlib.projections.polar.PolarAxes.set_theta_zero_locationmatplotlib.projections.polar.PolarAxes.set_thetaminmatplotlib.projections.polar.PolarAxes.set_thetamax
下载这个示例

若有收获,就点个赞吧
0 人点赞


