线的样式
这个例子展示了复制Tikz / PGF的不同线条样式。
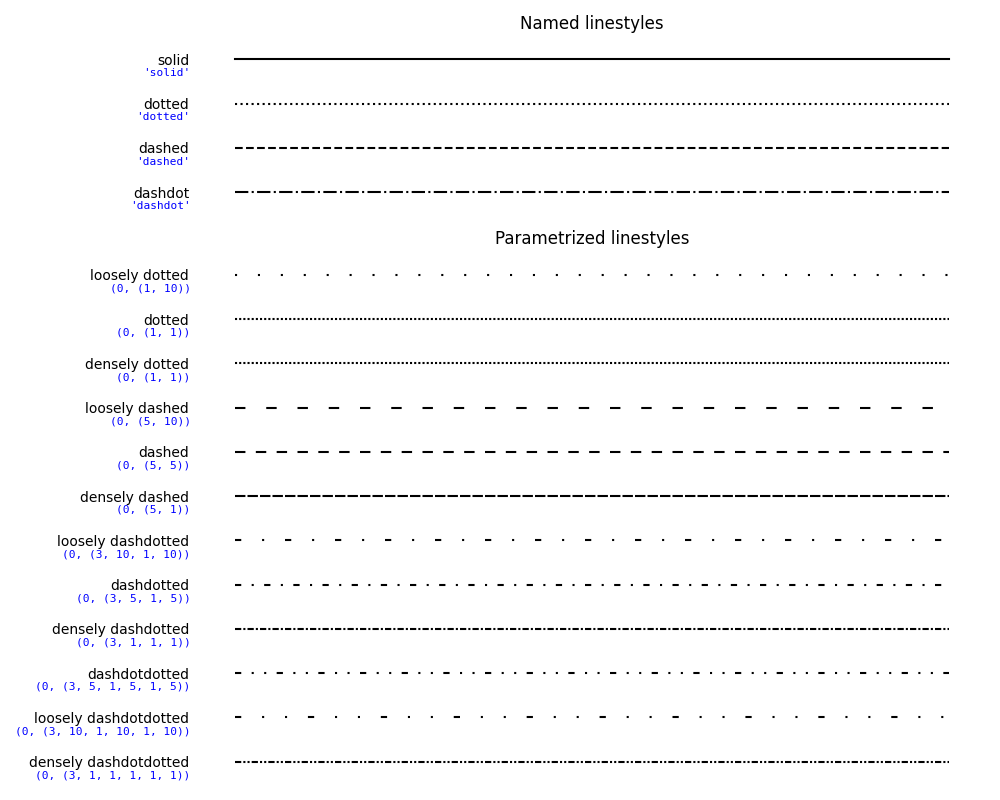
import numpy as npimport matplotlib.pyplot as pltfrom collections import OrderedDictfrom matplotlib.transforms import blended_transform_factorylinestyles = OrderedDict([('solid', (0, ())),('loosely dotted', (0, (1, 10))),('dotted', (0, (1, 5))),('densely dotted', (0, (1, 1))),('loosely dashed', (0, (5, 10))),('dashed', (0, (5, 5))),('densely dashed', (0, (5, 1))),('loosely dashdotted', (0, (3, 10, 1, 10))),('dashdotted', (0, (3, 5, 1, 5))),('densely dashdotted', (0, (3, 1, 1, 1))),('loosely dashdotdotted', (0, (3, 10, 1, 10, 1, 10))),('dashdotdotted', (0, (3, 5, 1, 5, 1, 5))),('densely dashdotdotted', (0, (3, 1, 1, 1, 1, 1)))])plt.figure(figsize=(10, 6))ax = plt.subplot(1, 1, 1)X, Y = np.linspace(0, 100, 10), np.zeros(10)for i, (name, linestyle) in enumerate(linestyles.items()):ax.plot(X, Y+i, linestyle=linestyle, linewidth=1.5, color='black')ax.set_ylim(-0.5, len(linestyles)-0.5)plt.yticks(np.arange(len(linestyles)), linestyles.keys())plt.xticks([])# For each line style, add a text annotation with a small offset from# the reference point (0 in Axes coords, y tick value in Data coords).reference_transform = blended_transform_factory(ax.transAxes, ax.transData)for i, (name, linestyle) in enumerate(linestyles.items()):ax.annotate(str(linestyle), xy=(0.0, i), xycoords=reference_transform,xytext=(-6, -12), textcoords='offset points', color="blue",fontsize=8, ha="right", family="monospace")plt.tight_layout()plt.show()
下载这个示例

若有收获,就点个赞吧
0 人点赞
