matplotlib艺术家对象的参考
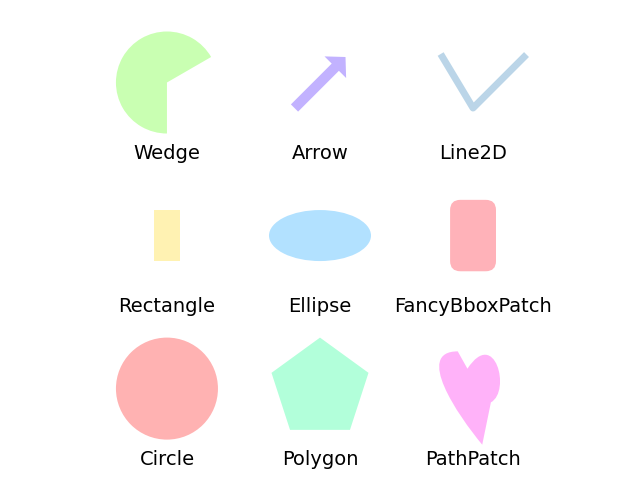
此示例显示使用matplotlib API绘制的几个matplotlib的图形基元(艺术家)。艺术家对象API提供完整的艺术家列表和文档。
Copyright (c) 2010, Bartosz Telenczuk BSD License
import matplotlib.pyplot as pltimport numpy as npimport matplotlib.path as mpathimport matplotlib.lines as mlinesimport matplotlib.patches as mpatchesfrom matplotlib.collections import PatchCollectiondef label(xy, text):y = xy[1] - 0.15 # shift y-value for label so that it's below the artistplt.text(xy[0], y, text, ha="center", family='sans-serif', size=14)fig, ax = plt.subplots()# create 3x3 grid to plot the artistsgrid = np.mgrid[0.2:0.8:3j, 0.2:0.8:3j].reshape(2, -1).Tpatches = []# add a circlecircle = mpatches.Circle(grid[0], 0.1, ec="none")patches.append(circle)label(grid[0], "Circle")# add a rectanglerect = mpatches.Rectangle(grid[1] - [0.025, 0.05], 0.05, 0.1, ec="none")patches.append(rect)label(grid[1], "Rectangle")# add a wedgewedge = mpatches.Wedge(grid[2], 0.1, 30, 270, ec="none")patches.append(wedge)label(grid[2], "Wedge")# add a Polygonpolygon = mpatches.RegularPolygon(grid[3], 5, 0.1)patches.append(polygon)label(grid[3], "Polygon")# add an ellipseellipse = mpatches.Ellipse(grid[4], 0.2, 0.1)patches.append(ellipse)label(grid[4], "Ellipse")# add an arrowarrow = mpatches.Arrow(grid[5, 0] - 0.05, grid[5, 1] - 0.05, 0.1, 0.1,width=0.1)patches.append(arrow)label(grid[5], "Arrow")# add a path patchPath = mpath.Pathpath_data = [(Path.MOVETO, [0.018, -0.11]),(Path.CURVE4, [-0.031, -0.051]),(Path.CURVE4, [-0.115, 0.073]),(Path.CURVE4, [-0.03, 0.073]),(Path.LINETO, [-0.011, 0.039]),(Path.CURVE4, [0.043, 0.121]),(Path.CURVE4, [0.075, -0.005]),(Path.CURVE4, [0.035, -0.027]),(Path.CLOSEPOLY, [0.018, -0.11])]codes, verts = zip(*path_data)path = mpath.Path(verts + grid[6], codes)patch = mpatches.PathPatch(path)patches.append(patch)label(grid[6], "PathPatch")# add a fancy boxfancybox = mpatches.FancyBboxPatch(grid[7] - [0.025, 0.05], 0.05, 0.1,boxstyle=mpatches.BoxStyle("Round", pad=0.02))patches.append(fancybox)label(grid[7], "FancyBboxPatch")# add a linex, y = np.array([[-0.06, 0.0, 0.1], [0.05, -0.05, 0.05]])line = mlines.Line2D(x + grid[8, 0], y + grid[8, 1], lw=5., alpha=0.3)label(grid[8], "Line2D")colors = np.linspace(0, 1, len(patches))collection = PatchCollection(patches, cmap=plt.cm.hsv, alpha=0.3)collection.set_array(np.array(colors))ax.add_collection(collection)ax.add_line(line)plt.axis('equal')plt.axis('off')plt.tight_layout()plt.show()
参考
此示例中显示了以下函数,方法,类和模块的使用:
import matplotlibmatplotlib.pathmatplotlib.path.Pathmatplotlib.linesmatplotlib.lines.Line2Dmatplotlib.patchesmatplotlib.patches.Circlematplotlib.patches.Ellipsematplotlib.patches.Wedgematplotlib.patches.Rectanglematplotlib.patches.Arrowmatplotlib.patches.PathPatchmatplotlib.patches.FancyBboxPatchmatplotlib.patches.RegularPolygonmatplotlib.collectionsmatplotlib.collections.PatchCollectionmatplotlib.cm.ScalarMappable.set_arraymatplotlib.axes.Axes.add_collectionmatplotlib.axes.Axes.add_line
下载这个示例

若有收获,就点个赞吧
0 人点赞
