hlines和vlines
此示例展示了hlines和vlines的功能。
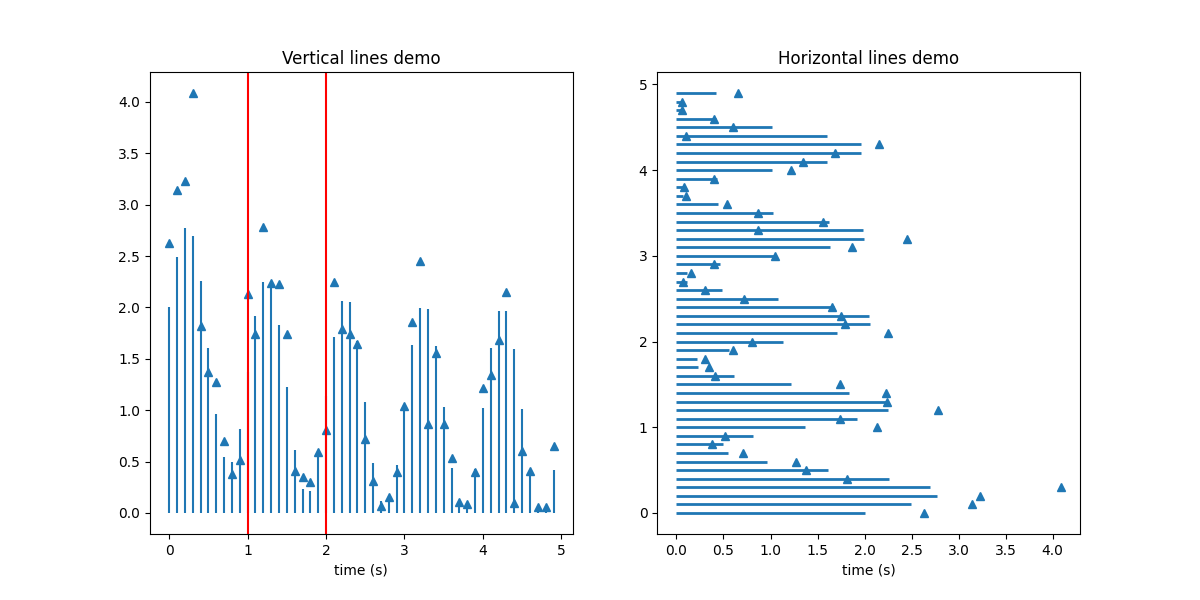
import matplotlib.pyplot as pltimport numpy as npt = np.arange(0.0, 5.0, 0.1)s = np.exp(-t) + np.sin(2 * np.pi * t) + 1nse = np.random.normal(0.0, 0.3, t.shape) * sfig, (vax, hax) = plt.subplots(1, 2, figsize=(12, 6))vax.plot(t, s + nse, '^')vax.vlines(t, [0], s)# By using ``transform=vax.get_xaxis_transform()`` the y coordinates are scaled# such that 0 maps to the bottom of the axes and 1 to the top.vax.vlines([1, 2], 0, 1, transform=vax.get_xaxis_transform(), colors='r')vax.set_xlabel('time (s)')vax.set_title('Vertical lines demo')hax.plot(s + nse, t, '^')hax.hlines(t, [0], s, lw=2)hax.set_xlabel('time (s)')hax.set_title('Horizontal lines demo')plt.show()
下载这个示例

若有收获,就点个赞吧
0 人点赞
