注释变换
此示例显示如何使用不同的坐标系进行注释。 有关注释功能的完整概述,另请参阅注释教程。
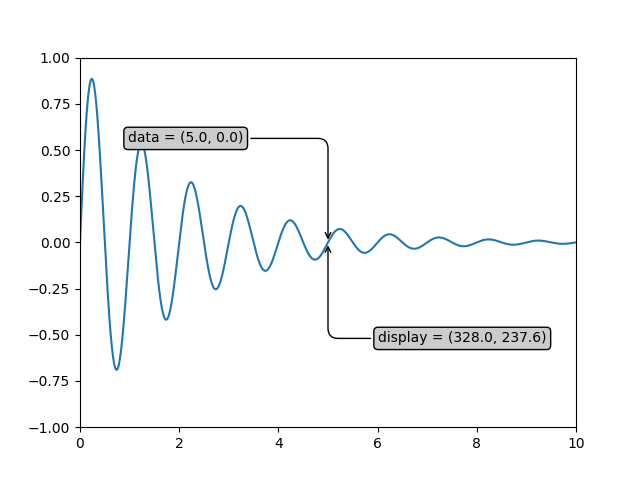
import numpy as npimport matplotlib.pyplot as pltx = np.arange(0, 10, 0.005)y = np.exp(-x/2.) * np.sin(2*np.pi*x)fig, ax = plt.subplots()ax.plot(x, y)ax.set_xlim(0, 10)ax.set_ylim(-1, 1)xdata, ydata = 5, 0xdisplay, ydisplay = ax.transData.transform_point((xdata, ydata))bbox = dict(boxstyle="round", fc="0.8")arrowprops = dict(arrowstyle = "->",connectionstyle = "angle,angleA=0,angleB=90,rad=10")offset = 72ax.annotate('data = (%.1f, %.1f)'%(xdata, ydata),(xdata, ydata), xytext=(-2*offset, offset), textcoords='offset points',bbox=bbox, arrowprops=arrowprops)disp = ax.annotate('display = (%.1f, %.1f)'%(xdisplay, ydisplay),(xdisplay, ydisplay), xytext=(0.5*offset, -offset),xycoords='figure pixels',textcoords='offset points',bbox=bbox, arrowprops=arrowprops)plt.show()
参考
此示例中显示了以下函数,方法,类和模块的使用:
import matplotlibmatplotlib.transforms.Transform.transform_pointmatplotlib.axes.Axes.annotatematplotlib.pyplot.annotate
下载这个示例

若有收获,就点个赞吧
0 人点赞
