连接简单例子01
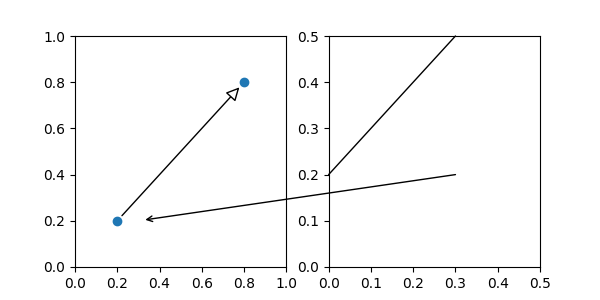
from matplotlib.patches import ConnectionPatchimport matplotlib.pyplot as pltfig, (ax1, ax2) = plt.subplots(1, 2, figsize=(6, 3))xyA = (0.2, 0.2)xyB = (0.8, 0.8)coordsA = "data"coordsB = "data"con = ConnectionPatch(xyA, xyB, coordsA, coordsB,arrowstyle="-|>", shrinkA=5, shrinkB=5,mutation_scale=20, fc="w")ax1.plot([xyA[0], xyB[0]], [xyA[1], xyB[1]], "o")ax1.add_artist(con)xy = (0.3, 0.2)coordsA = "data"coordsB = "data"con = ConnectionPatch(xyA=xy, xyB=xy, coordsA=coordsA, coordsB=coordsB,axesA=ax2, axesB=ax1,arrowstyle="->", shrinkB=5)ax2.add_artist(con)ax1.set_xlim(0, 1)ax1.set_ylim(0, 1)ax2.set_xlim(0, .5)ax2.set_ylim(0, .5)plt.show()
下载这个示例

若有收获,就点个赞吧
0 人点赞
