不规则空间数据的等高线图
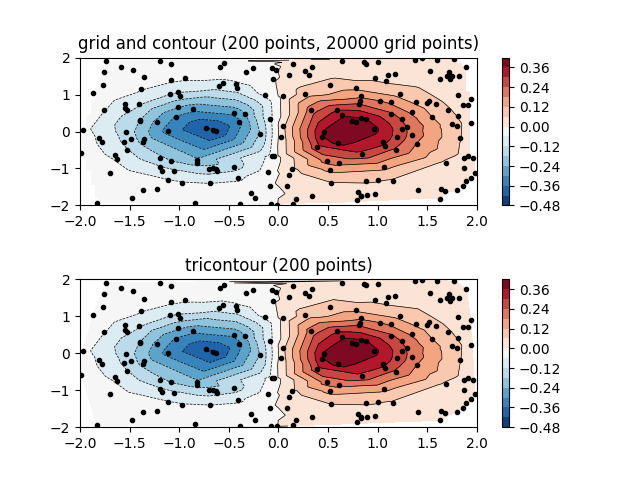
不规则空间数据在规则网格上插值的等高线图与非结构三角形网格的三棱图的比较。
由于 contour 和 contourf 期望数据存在于规则网格上,因此绘制不规则间隔数据的等高线图需要不同的方法。这两个选项是:
- 首先将数据插值到常规网格。这可以通过机载装置完成,例如,通过LinearTriInterpolator或使用外部功能,例如 通过scipy.interpolate.griddata。然后用常规的等高线绘制插值数据。
- 直接使用tricontour或tricontourf,它将在内部进行三角测量。
此示例显示了两种方法。
import matplotlib.pyplot as pltimport matplotlib.tri as triimport numpy as npnp.random.seed(19680801)npts = 200ngridx = 100ngridy = 200x = np.random.uniform(-2, 2, npts)y = np.random.uniform(-2, 2, npts)z = x * np.exp(-x**2 - y**2)fig, (ax1, ax2) = plt.subplots(nrows=2)# -----------------------# Interpolation on a grid# -----------------------# A contour plot of irregularly spaced data coordinates# via interpolation on a grid.# Create grid values first.xi = np.linspace(-2.1, 2.1, ngridx)yi = np.linspace(-2.1, 2.1, ngridy)# Perform linear interpolation of the data (x,y)# on a grid defined by (xi,yi)triang = tri.Triangulation(x, y)interpolator = tri.LinearTriInterpolator(triang, z)Xi, Yi = np.meshgrid(xi, yi)zi = interpolator(Xi, Yi)# Note that scipy.interpolate provides means to interpolate data on a grid# as well. The following would be an alternative to the four lines above:#from scipy.interpolate import griddata#zi = griddata((x, y), z, (xi[None,:], yi[:,None]), method='linear')ax1.contour(xi, yi, zi, levels=14, linewidths=0.5, colors='k')cntr1 = ax1.contourf(xi, yi, zi, levels=14, cmap="RdBu_r")fig.colorbar(cntr1, ax=ax1)ax1.plot(x, y, 'ko', ms=3)ax1.axis((-2, 2, -2, 2))ax1.set_title('grid and contour (%d points, %d grid points)' %(npts, ngridx * ngridy))# ----------# Tricontour# ----------# Directly supply the unordered, irregularly spaced coordinates# to tricontour.ax2.tricontour(x, y, z, levels=14, linewidths=0.5, colors='k')cntr2 = ax2.tricontourf(x, y, z, levels=14, cmap="RdBu_r")fig.colorbar(cntr2, ax=ax2)ax2.plot(x, y, 'ko', ms=3)ax2.axis((-2, 2, -2, 2))ax2.set_title('tricontour (%d points)' % npts)plt.subplots_adjust(hspace=0.5)plt.show()
参考
此示例中显示了以下函数和方法的用法:
import matplotlibmatplotlib.axes.Axes.contourmatplotlib.pyplot.contourmatplotlib.axes.Axes.contourfmatplotlib.pyplot.contourfmatplotlib.axes.Axes.tricontourmatplotlib.pyplot.tricontourmatplotlib.axes.Axes.tricontourfmatplotlib.pyplot.tricontourf
下载这个示例

若有收获,就点个赞吧
0 人点赞
