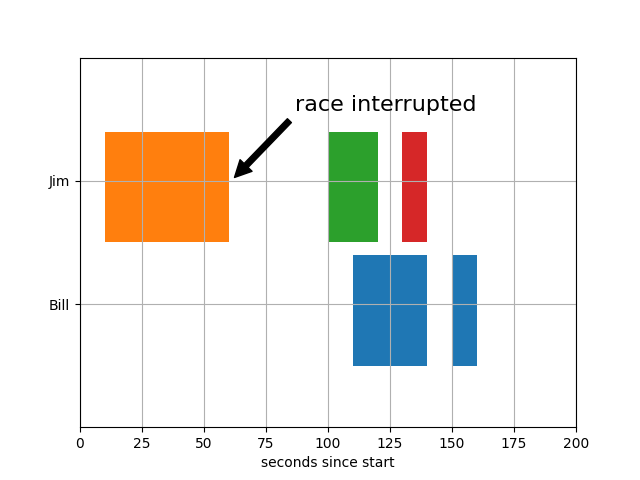
破损条形图
制作一个“破损”的水平条形图,即一个有间隙的条形图
 ;
;
import matplotlib.pyplot as pltfig, ax = plt.subplots()ax.broken_barh([(110, 30), (150, 10)], (10, 9), facecolors='blue')ax.broken_barh([(10, 50), (100, 20), (130, 10)], (20, 9),facecolors=('red', 'yellow', 'green'))ax.set_ylim(5, 35)ax.set_xlim(0, 200)ax.set_xlabel('seconds since start')ax.set_yticks([15, 25])ax.set_yticklabels(['Bill', 'Jim'])ax.grid(True)ax.annotate('race interrupted', (61, 25),xytext=(0.8, 0.9), textcoords='axes fraction',arrowprops=dict(facecolor='black', shrink=0.05),fontsize=16,horizontalalignment='right', verticalalignment='top')plt.show()
下载这个示例

若有收获,就点个赞吧
0 人点赞
