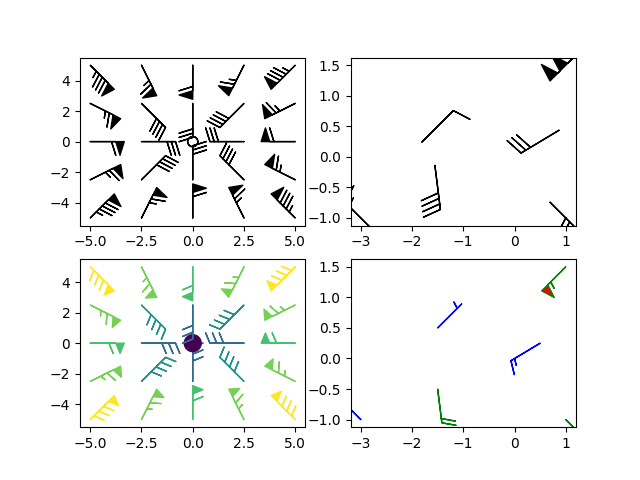
倒勾图示例
倒勾图的示例:
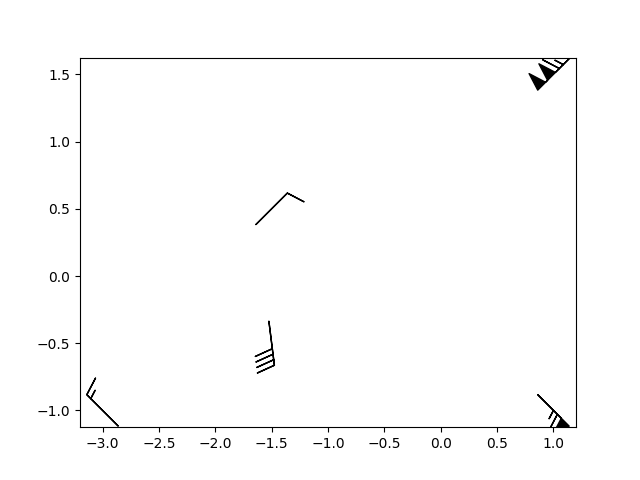
import matplotlib.pyplot as pltimport numpy as npx = np.linspace(-5, 5, 5)X, Y = np.meshgrid(x, x)U, V = 12 * X, 12 * Ydata = [(-1.5, .5, -6, -6),(1, -1, -46, 46),(-3, -1, 11, -11),(1, 1.5, 80, 80),(0.5, 0.25, 25, 15),(-1.5, -0.5, -5, 40)]data = np.array(data, dtype=[('x', np.float32), ('y', np.float32),('u', np.float32), ('v', np.float32)])fig1, axs1 = plt.subplots(nrows=2, ncols=2)# Default parameters, uniform gridaxs1[0, 0].barbs(X, Y, U, V)# Arbitrary set of vectors, make them longer and change the pivot point# (point around which they're rotated) to be the middleaxs1[0, 1].barbs(data['x'], data['y'], data['u'], data['v'], length=8, pivot='middle')# Showing colormapping with uniform grid. Fill the circle for an empty barb,# don't round the values, and change some of the size parametersaxs1[1, 0].barbs(X, Y, U, V, np.sqrt(U * U + V * V), fill_empty=True, rounding=False,sizes=dict(emptybarb=0.25, spacing=0.2, height=0.3))# Change colors as well as the increments for parts of the barbsaxs1[1, 1].barbs(data['x'], data['y'], data['u'], data['v'], flagcolor='r',barbcolor=['b', 'g'], flip_barb=True,barb_increments=dict(half=10, full=20, flag=100))# Masked arrays are also supportedmasked_u = np.ma.masked_array(data['u'])masked_u[4] = 1000 # Bad value that should not be plotted when maskedmasked_u[4] = np.ma.masked# Identical plot to panel 2 in the first figure, but with the point at# (0.5, 0.25) missing (masked)fig2, ax2 = plt.subplots()ax2.barbs(data['x'], data['y'], masked_u, data['v'], length=8, pivot='middle')plt.show()
参考
此示例中显示了以下函数,方法和类的使用:
import matplotlibmatplotlib.axes.Axes.barbsmatplotlib.pyplot.barbs
下载这个示例

若有收获,就点个赞吧
0 人点赞
