贝叶斯更新
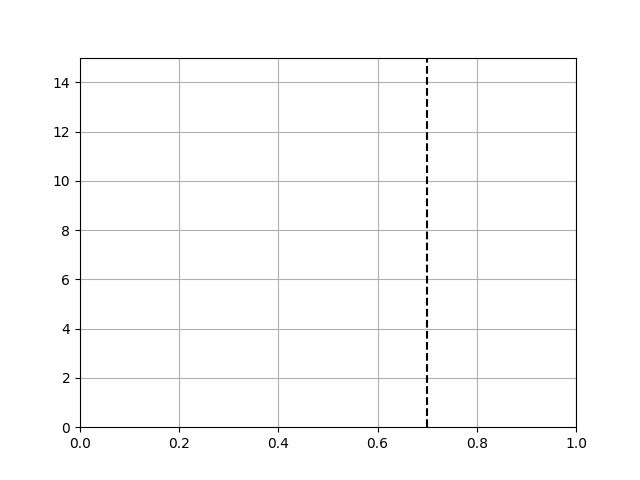
此动画显示在新数据到达时重新安装的后验估计更新。
垂直线表示绘制的分布应该收敛的理论值。
import mathimport numpy as npimport matplotlib.pyplot as pltfrom matplotlib.animation import FuncAnimationdef beta_pdf(x, a, b):return (x**(a-1) * (1-x)**(b-1) * math.gamma(a + b)/ (math.gamma(a) * math.gamma(b)))class UpdateDist(object):def __init__(self, ax, prob=0.5):self.success = 0self.prob = probself.line, = ax.plot([], [], 'k-')self.x = np.linspace(0, 1, 200)self.ax = ax# Set up plot parametersself.ax.set_xlim(0, 1)self.ax.set_ylim(0, 15)self.ax.grid(True)# This vertical line represents the theoretical value, to# which the plotted distribution should converge.self.ax.axvline(prob, linestyle='--', color='black')def init(self):self.success = 0self.line.set_data([], [])return self.line,def __call__(self, i):# This way the plot can continuously run and we just keep# watching new realizations of the processif i == 0:return self.init()# Choose success based on exceed a threshold with a uniform pickif np.random.rand(1,) < self.prob:self.success += 1y = beta_pdf(self.x, self.success + 1, (i - self.success) + 1)self.line.set_data(self.x, y)return self.line,# Fixing random state for reproducibilitynp.random.seed(19680801)fig, ax = plt.subplots()ud = UpdateDist(ax, prob=0.7)anim = FuncAnimation(fig, ud, frames=np.arange(100), init_func=ud.init,interval=100, blit=True)plt.show()
下载这个示例

若有收获,就点个赞吧
0 人点赞
