在不同的平面中创建二维条形图
演示制作3D绘图,其中2D条形图投影到平面y = 0,y = 1等。
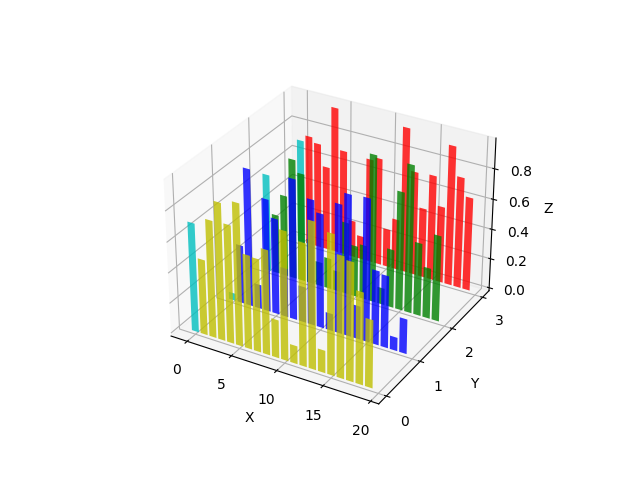
# This import registers the 3D projection, but is otherwise unused.from mpl_toolkits.mplot3d import Axes3D # noqa: F401 unused importimport matplotlib.pyplot as pltimport numpy as np# Fixing random state for reproducibilitynp.random.seed(19680801)fig = plt.figure()ax = fig.add_subplot(111, projection='3d')colors = ['r', 'g', 'b', 'y']yticks = [3, 2, 1, 0]for c, k in zip(colors, yticks):# Generate the random data for the y=k 'layer'.xs = np.arange(20)ys = np.random.rand(20)# You can provide either a single color or an array with the same length as# xs and ys. To demonstrate this, we color the first bar of each set cyan.cs = [c] * len(xs)cs[0] = 'c'# Plot the bar graph given by xs and ys on the plane y=k with 80% opacity.ax.bar(xs, ys, zs=k, zdir='y', color=cs, alpha=0.8)ax.set_xlabel('X')ax.set_ylabel('Y')ax.set_zlabel('Z')# On the y axis let's only label the discrete values that we have data for.ax.set_yticks(yticks)plt.show()
下载这个示例

若有收获,就点个赞吧
0 人点赞
