轻松创建子图
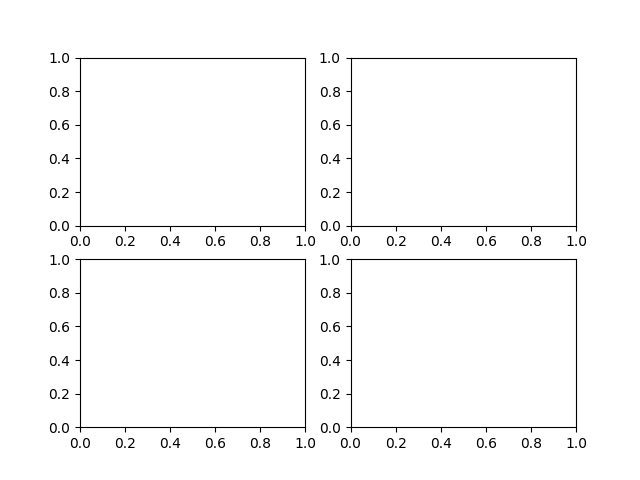
在matplotlib的早期版本中,如果你想使用pythonic API并创建一个图形实例,并从中创建一个子图的网格,可能有共享轴,它涉及相当数量的样板代码。例如:
import matplotlib.pyplot as pltimport numpy as npx = np.random.randn(50)# old stylefig = plt.figure()ax1 = fig.add_subplot(221)ax2 = fig.add_subplot(222, sharex=ax1, sharey=ax1)ax3 = fig.add_subplot(223, sharex=ax1, sharey=ax1)ax3 = fig.add_subplot(224, sharex=ax1, sharey=ax1)
费尔南多·佩雷斯提供了一个很好的方法来创建子图的一切 subplots()(最后注意“s”),并为整个群体打开x和y共享。您可以单独打开轴…
# new style method 1; unpack the axesfig, ((ax1, ax2), (ax3, ax4)) = plt.subplots(2, 2, sharex=True, sharey=True)ax1.plot(x)
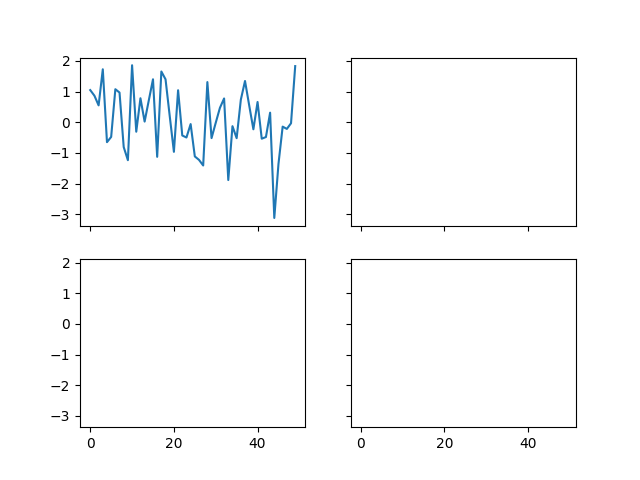
或者将它们作为支持numpy索引的numrows x numcolumns对象数组返回
# new style method 2; use an axes arrayfig, axs = plt.subplots(2, 2, sharex=True, sharey=True)axs[0, 0].plot(x)plt.show()

下载这个示例

若有收获,就点个赞吧
0 人点赞
