数学文本图像作为numpy数组
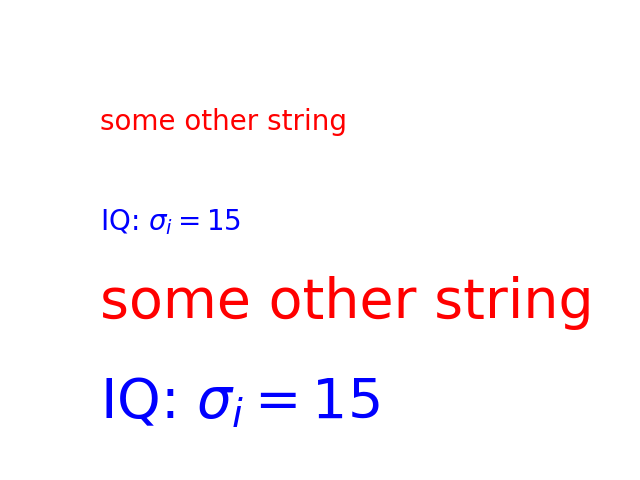
从LaTeX字符串制作图像。
import matplotlib.mathtext as mathtextimport matplotlib.pyplot as pltimport matplotlibmatplotlib.rc('image', origin='upper')parser = mathtext.MathTextParser("Bitmap")parser.to_png('test2.png',r'$\left[\left\lfloor\frac{5}{\frac{\left(3\right)}{4}} 'r'y\right)\right]$', color='green', fontsize=14, dpi=100)rgba1, depth1 = parser.to_rgba(r'IQ: $\sigma_i=15$', color='blue', fontsize=20, dpi=200)rgba2, depth2 = parser.to_rgba(r'some other string', color='red', fontsize=20, dpi=200)fig = plt.figure()fig.figimage(rgba1, 100, 100)fig.figimage(rgba2, 100, 300)plt.show()
参考
此示例中显示了以下函数,方法,类和模块的使用:
import matplotlibmatplotlib.mathtextmatplotlib.mathtext.MathTextParsermatplotlib.mathtext.MathTextParser.to_pngmatplotlib.mathtext.MathTextParser.to_rgbamatplotlib.figure.Figure.figimage
下载这个示例

若有收获,就点个赞吧
0 人点赞
