等高线标签演示
说明一些可以用等高线的标签做的更高级的东西。
另请参见轮廓演示示例。
import matplotlibimport numpy as npimport matplotlib.ticker as tickerimport matplotlib.pyplot as plt
定义我们的外观
delta = 0.025x = np.arange(-3.0, 3.0, delta)y = np.arange(-2.0, 2.0, delta)X, Y = np.meshgrid(x, y)Z1 = np.exp(-X**2 - Y**2)Z2 = np.exp(-(X - 1)**2 - (Y - 1)**2)Z = (Z1 - Z2) * 2
使用创造性的浮动类制作等高线的标签,遵循曼纽尔·梅茨的建议。
# Define a class that forces representation of float to look a certain way# This remove trailing zero so '1.0' becomes '1'class nf(float):def __repr__(self):str = '%.1f' % (self.__float__(),)if str[-1] == '0':return '%.0f' % self.__float__()else:return '%.1f' % self.__float__()# Basic contour plotfig, ax = plt.subplots()CS = ax.contour(X, Y, Z)# Recast levels to new classCS.levels = [nf(val) for val in CS.levels]# Label levels with specially formatted floatsif plt.rcParams["text.usetex"]:fmt = r'%r \%%'else:fmt = '%r %%'ax.clabel(CS, CS.levels, inline=True, fmt=fmt, fontsize=10)

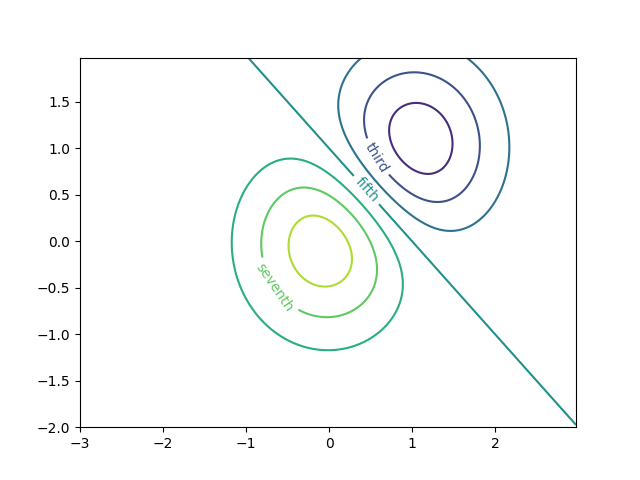
使用字典用任意字符串标记等高线
fig1, ax1 = plt.subplots()# Basic contour plotCS1 = ax1.contour(X, Y, Z)fmt = {}strs = ['first', 'second', 'third', 'fourth', 'fifth', 'sixth', 'seventh']for l, s in zip(CS1.levels, strs):fmt[l] = s# Label every other level using stringsax1.clabel(CS1, CS1.levels[::2], inline=True, fmt=fmt, fontsize=10)
使用Formatter来格式化
fig2, ax2 = plt.subplots()CS2 = ax2.contour(X, Y, 100**Z, locator=plt.LogLocator())fmt = ticker.LogFormatterMathtext()fmt.create_dummy_axis()ax2.clabel(CS2, CS2.levels, fmt=fmt)ax2.set_title("$100^Z$")plt.show()

参考
本例中显示了以下函数、方法和类的使用:
matplotlib.axes.Axes.contourmatplotlib.pyplot.contourmatplotlib.axes.Axes.clabelmatplotlib.pyplot.clabelmatplotlib.ticker.LogFormatterMathtextmatplotlib.ticker.TickHelper.create_dummy_axis
下载这个示例

若有收获,就点个赞吧
0 人点赞
