图形图例演示
不是在每个轴上绘制图例,而是可以绘制图形的所有子轴上的所有艺术家的图例。
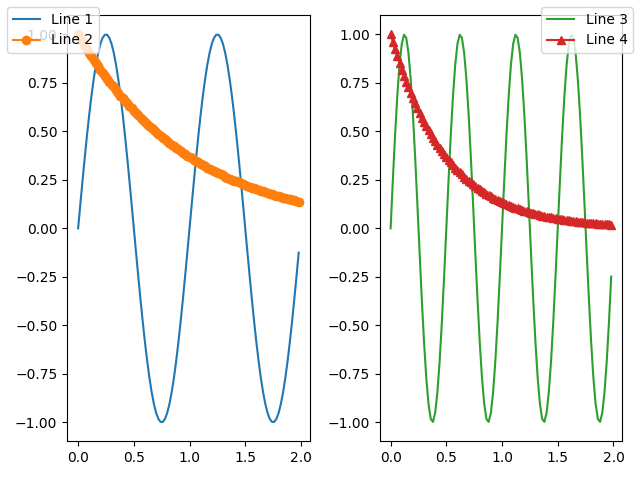
import numpy as npimport matplotlib.pyplot as pltfig, axs = plt.subplots(1, 2)x = np.arange(0.0, 2.0, 0.02)y1 = np.sin(2 * np.pi * x)y2 = np.exp(-x)l1, l2 = axs[0].plot(x, y1, 'rs-', x, y2, 'go')y3 = np.sin(4 * np.pi * x)y4 = np.exp(-2 * x)l3, l4 = axs[1].plot(x, y3, 'yd-', x, y4, 'k^')fig.legend((l1, l2), ('Line 1', 'Line 2'), 'upper left')fig.legend((l3, l4), ('Line 3', 'Line 4'), 'upper right')plt.tight_layout()plt.show()
下载这个示例

若有收获,就点个赞吧
0 人点赞
