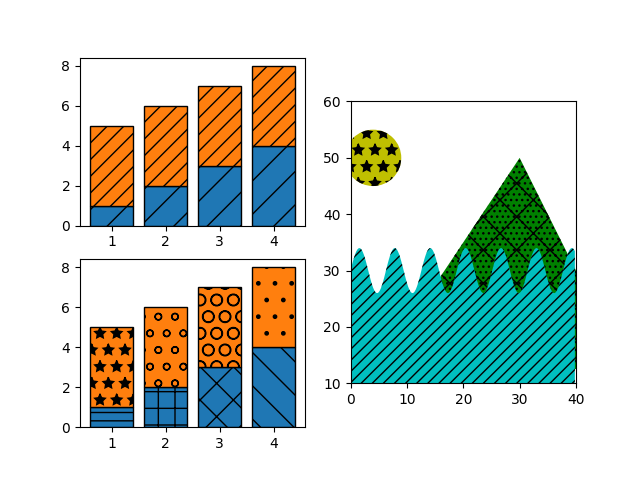
Hatch演示
目前仅在PS,PDF,SVG和Agg后端支持阴影线(图案填充多边形)。
import matplotlib.pyplot as pltfrom matplotlib.patches import Ellipse, Polygonfig, (ax1, ax2, ax3) = plt.subplots(3)ax1.bar(range(1, 5), range(1, 5), color='red', edgecolor='black', hatch="/")ax1.bar(range(1, 5), [6] * 4, bottom=range(1, 5),color='blue', edgecolor='black', hatch='//')ax1.set_xticks([1.5, 2.5, 3.5, 4.5])bars = ax2.bar(range(1, 5), range(1, 5), color='yellow', ecolor='black') + \ax2.bar(range(1, 5), [6] * 4, bottom=range(1, 5),color='green', ecolor='black')ax2.set_xticks([1.5, 2.5, 3.5, 4.5])patterns = ('-', '+', 'x', '\\', '*', 'o', 'O', '.')for bar, pattern in zip(bars, patterns):bar.set_hatch(pattern)ax3.fill([1, 3, 3, 1], [1, 1, 2, 2], fill=False, hatch='\\')ax3.add_patch(Ellipse((4, 1.5), 4, 0.5, fill=False, hatch='*'))ax3.add_patch(Polygon([[0, 0], [4, 1.1], [6, 2.5], [2, 1.4]], closed=True,fill=False, hatch='/'))ax3.set_xlim((0, 6))ax3.set_ylim((0, 2.5))plt.show()
参考
此示例中显示了以下函数,方法,类和模块的使用:
import matplotlibmatplotlib.patchesmatplotlib.patches.Ellipsematplotlib.patches.Polygonmatplotlib.axes.Axes.add_patchmatplotlib.patches.Patch.set_hatchmatplotlib.axes.Axes.barmatplotlib.pyplot.bar
下载这个示例

若有收获,就点个赞吧
0 人点赞
