Agg缓冲区转换数组
将渲染图形转换为其图像(NumPy数组)表示形式。

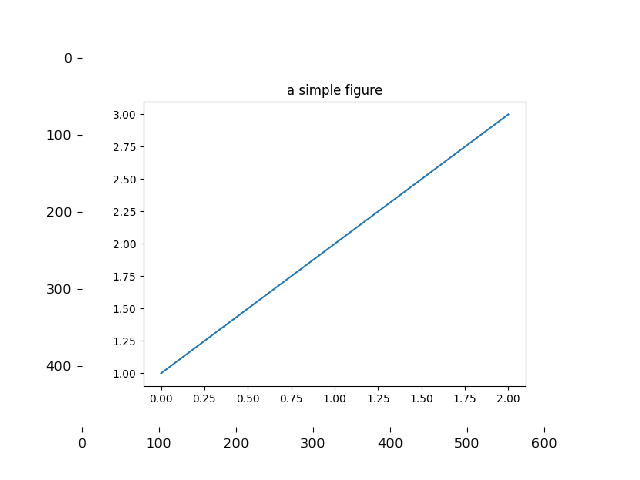
import matplotlib.pyplot as pltimport numpy as np# make an agg figurefig, ax = plt.subplots()ax.plot([1, 2, 3])ax.set_title('a simple figure')fig.canvas.draw()# grab the pixel buffer and dump it into a numpy arrayX = np.array(fig.canvas.renderer._renderer)# now display the array X as an Axes in a new figurefig2 = plt.figure()ax2 = fig2.add_subplot(111, frameon=False)ax2.imshow(X)plt.show()
下载这个示例

若有收获,就点个赞吧
0 人点赞
