选择事件演示
您可以通过设置艺术家的“选择器”属性来启用拾取(例如,matplotlib Line2D,Text,Patch,Polygon,AxesImage等…)
选择器属性有多种含义
- None - 此艺术家对象的选择功能已停用(默认)
- boolean - 如果为True,则启用拾取,如果鼠标事件在艺术家上方,艺术家将触发拾取事件
- float - 如果选择器是一个数字,则它被解释为以点为单位的epsilon容差,如果事件的数据在鼠标事件的epsilon内,则艺术家将触发事件。 对于某些艺术家(如线条和补丁集合),艺术家可能会为生成的挑选事件提供其他数据,例如,挑选事件的epsilon中的数据索引
function - 如果选择器是可调用的,则它是用户提供的函数,用于确定艺术家是否被鼠标事件命中。
hit, props = picker(artist, mouseevent)
确定命中测试。 如果鼠标事件在艺术家上方,则返回hit = True,props是要添加到PickEvent属性的属性字典
通过设置“选取器”属性启用艺术家进行拾取后,您需要连接到图形画布pick_event以获取鼠标按下事件的拾取回调。 例如,
def pick_handler(event):mouseevent = event.mouseevent artist = event.artist # now do something with this...
传递给回调的pick事件(matplotlib.backend_bases.PickEvent)始终使用两个属性触发:
mouseevent - 生成拾取事件的鼠标事件。 鼠标事件又具有x和y(显示空间中的坐标,如左下角的像素)和xdata,ydata(数据空间中的坐标)等属性。 此外,您可以获取有关按下哪些按钮,按下哪些键,鼠标所在的轴等的信息。有关详细信息,请参阅matplotlib.backend_bases.MouseEvent。
artist - 生成pick事件的matplotlib.artist。
此外,某些艺术家(如Line2D和PatchCollection)可能会将其他元数据(如索引)附加到符合选择器条件的数据中(例如,行中指定的epsilon容差范围内的所有点)
以下示例说明了这些方法中的每一种。
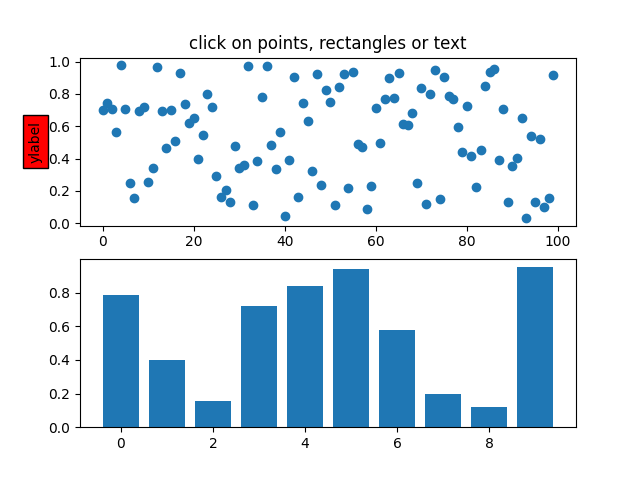
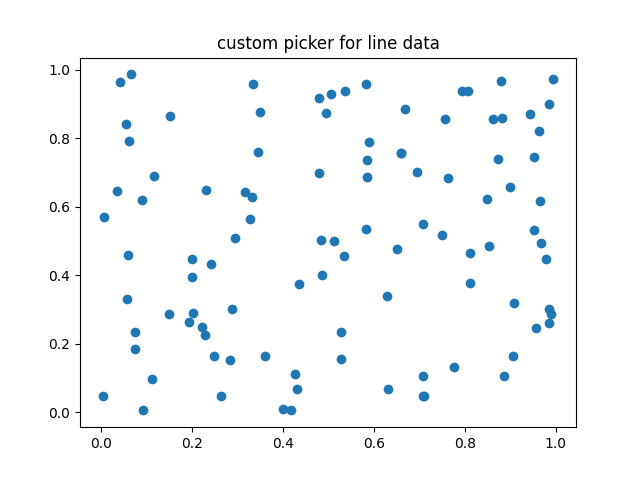

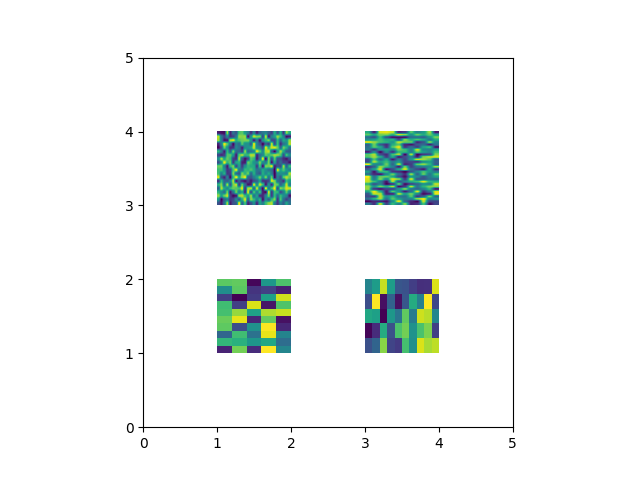
import matplotlib.pyplot as pltfrom matplotlib.lines import Line2Dfrom matplotlib.patches import Rectanglefrom matplotlib.text import Textfrom matplotlib.image import AxesImageimport numpy as npfrom numpy.random import randif 1: # simple picking, lines, rectangles and textfig, (ax1, ax2) = plt.subplots(2, 1)ax1.set_title('click on points, rectangles or text', picker=True)ax1.set_ylabel('ylabel', picker=True, bbox=dict(facecolor='red'))line, = ax1.plot(rand(100), 'o', picker=5) # 5 points tolerance# pick the rectanglebars = ax2.bar(range(10), rand(10), picker=True)for label in ax2.get_xticklabels(): # make the xtick labels pickablelabel.set_picker(True)def onpick1(event):if isinstance(event.artist, Line2D):thisline = event.artistxdata = thisline.get_xdata()ydata = thisline.get_ydata()ind = event.indprint('onpick1 line:', zip(np.take(xdata, ind), np.take(ydata, ind)))elif isinstance(event.artist, Rectangle):patch = event.artistprint('onpick1 patch:', patch.get_path())elif isinstance(event.artist, Text):text = event.artistprint('onpick1 text:', text.get_text())fig.canvas.mpl_connect('pick_event', onpick1)if 1: # picking with a custom hit test function# you can define custom pickers by setting picker to a callable# function. The function has the signature## hit, props = func(artist, mouseevent)## to determine the hit test. if the mouse event is over the artist,# return hit=True and props is a dictionary of# properties you want added to the PickEvent attributesdef line_picker(line, mouseevent):"""find the points within a certain distance from the mouseclick indata coords and attach some extra attributes, pickx and pickywhich are the data points that were picked"""if mouseevent.xdata is None:return False, dict()xdata = line.get_xdata()ydata = line.get_ydata()maxd = 0.05d = np.sqrt((xdata - mouseevent.xdata)**2. + (ydata - mouseevent.ydata)**2.)ind = np.nonzero(np.less_equal(d, maxd))if len(ind):pickx = np.take(xdata, ind)picky = np.take(ydata, ind)props = dict(ind=ind, pickx=pickx, picky=picky)return True, propselse:return False, dict()def onpick2(event):print('onpick2 line:', event.pickx, event.picky)fig, ax = plt.subplots()ax.set_title('custom picker for line data')line, = ax.plot(rand(100), rand(100), 'o', picker=line_picker)fig.canvas.mpl_connect('pick_event', onpick2)if 1: # picking on a scatter plot (matplotlib.collections.RegularPolyCollection)x, y, c, s = rand(4, 100)def onpick3(event):ind = event.indprint('onpick3 scatter:', ind, np.take(x, ind), np.take(y, ind))fig, ax = plt.subplots()col = ax.scatter(x, y, 100*s, c, picker=True)#fig.savefig('pscoll.eps')fig.canvas.mpl_connect('pick_event', onpick3)if 1: # picking images (matplotlib.image.AxesImage)fig, ax = plt.subplots()im1 = ax.imshow(rand(10, 5), extent=(1, 2, 1, 2), picker=True)im2 = ax.imshow(rand(5, 10), extent=(3, 4, 1, 2), picker=True)im3 = ax.imshow(rand(20, 25), extent=(1, 2, 3, 4), picker=True)im4 = ax.imshow(rand(30, 12), extent=(3, 4, 3, 4), picker=True)ax.axis([0, 5, 0, 5])def onpick4(event):artist = event.artistif isinstance(artist, AxesImage):im = artistA = im.get_array()print('onpick4 image', A.shape)fig.canvas.mpl_connect('pick_event', onpick4)plt.show()
下载这个示例

若有收获,就点个赞吧
0 人点赞
