散点图自定义符号
在散点图中创建自定义椭圆符号。
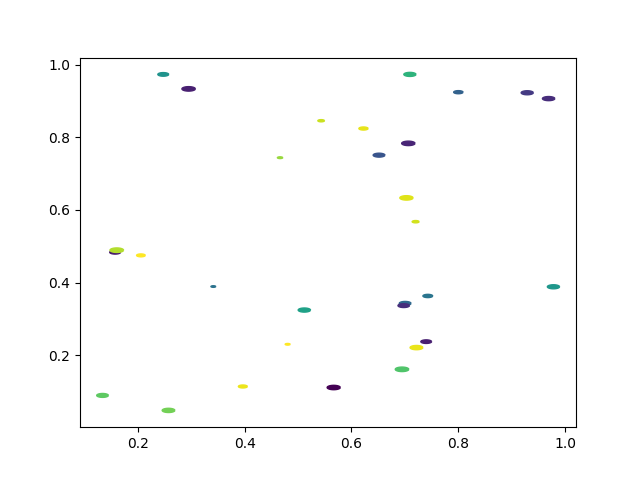
import matplotlib.pyplot as pltimport numpy as np# unit area ellipserx, ry = 3., 1.area = rx * ry * np.pitheta = np.arange(0, 2 * np.pi + 0.01, 0.1)verts = np.column_stack([rx / area * np.cos(theta), ry / area * np.sin(theta)])x, y, s, c = np.random.rand(4, 30)s *= 10**2.fig, ax = plt.subplots()ax.scatter(x, y, s, c, marker=verts)plt.show()
下载这个示例

若有收获,就点个赞吧
0 人点赞
