单选按钮
使用单选按钮选择绘图的属性。
单选按钮允许您在可视化中选择多个选项。在这种情况下,按钮允许用户选择要在图中显示的三种不同正弦波中的一种。
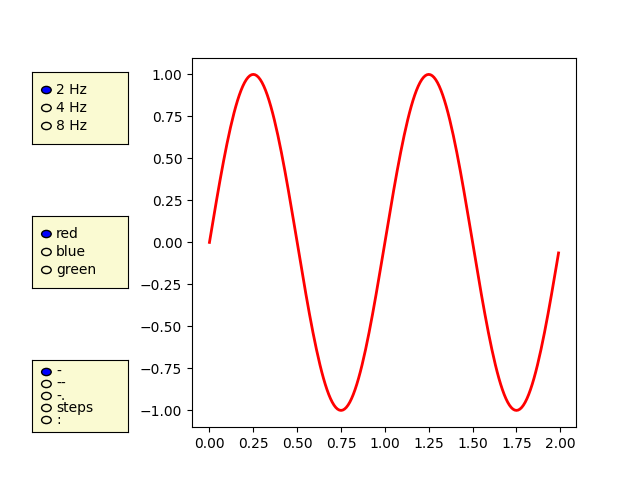
import numpy as npimport matplotlib.pyplot as pltfrom matplotlib.widgets import RadioButtonst = np.arange(0.0, 2.0, 0.01)s0 = np.sin(2*np.pi*t)s1 = np.sin(4*np.pi*t)s2 = np.sin(8*np.pi*t)fig, ax = plt.subplots()l, = ax.plot(t, s0, lw=2, color='red')plt.subplots_adjust(left=0.3)axcolor = 'lightgoldenrodyellow'rax = plt.axes([0.05, 0.7, 0.15, 0.15], facecolor=axcolor)radio = RadioButtons(rax, ('2 Hz', '4 Hz', '8 Hz'))def hzfunc(label):hzdict = {'2 Hz': s0, '4 Hz': s1, '8 Hz': s2}ydata = hzdict[label]l.set_ydata(ydata)plt.draw()radio.on_clicked(hzfunc)rax = plt.axes([0.05, 0.4, 0.15, 0.15], facecolor=axcolor)radio2 = RadioButtons(rax, ('red', 'blue', 'green'))def colorfunc(label):l.set_color(label)plt.draw()radio2.on_clicked(colorfunc)rax = plt.axes([0.05, 0.1, 0.15, 0.15], facecolor=axcolor)radio3 = RadioButtons(rax, ('-', '--', '-.', 'steps', ':'))def stylefunc(label):l.set_linestyle(label)plt.draw()radio3.on_clicked(stylefunc)plt.show()
下载这个示例

若有收获,就点个赞吧
0 人点赞
