色彩映射规范化Symlognorm
演示使用规范以非线性方式将颜色映射映射到数据上。
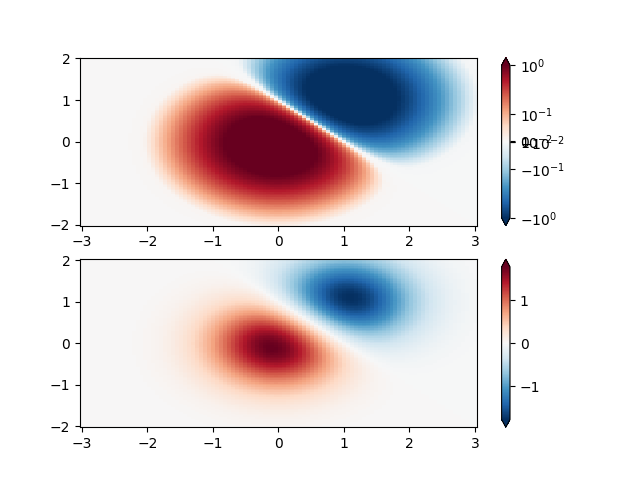
import numpy as npimport matplotlib.pyplot as pltimport matplotlib.colors as colors"""SymLogNorm: two humps, one negative and one positive, The positivewith 5-times the amplitude. Linearly, you cannot see detail in thenegative hump. Here we logarithmically scale the positive andnegative data separately.Note that colorbar labels do not come out looking very good."""N = 100X, Y = np.mgrid[-3:3:complex(0, N), -2:2:complex(0, N)]Z1 = np.exp(-X**2 - Y**2)Z2 = np.exp(-(X - 1)**2 - (Y - 1)**2)Z = (Z1 - Z2) * 2fig, ax = plt.subplots(2, 1)pcm = ax[0].pcolormesh(X, Y, Z,norm=colors.SymLogNorm(linthresh=0.03, linscale=0.03,vmin=-1.0, vmax=1.0),cmap='RdBu_r')fig.colorbar(pcm, ax=ax[0], extend='both')pcm = ax[1].pcolormesh(X, Y, Z, cmap='RdBu_r', vmin=-np.max(Z))fig.colorbar(pcm, ax=ax[1], extend='both')plt.show()
下载这个示例

若有收获,就点个赞吧
0 人点赞
