MRI与脑电图
显示一组带有MRI图像的子图,其强度直方图和一些EEG轨迹。
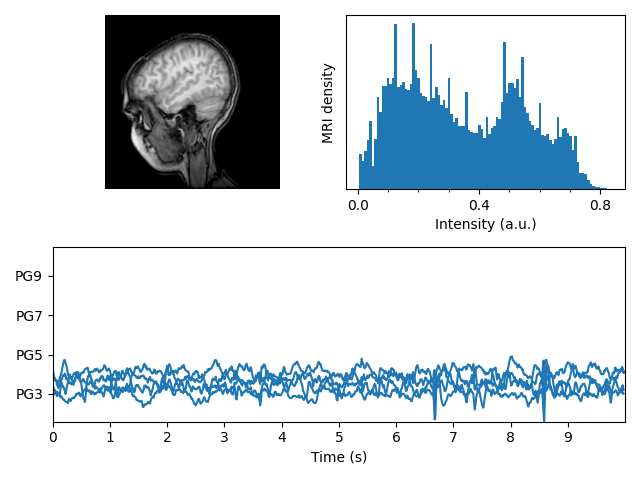
import numpy as npimport matplotlib.pyplot as pltimport matplotlib.cbook as cbookimport matplotlib.cm as cmfrom matplotlib.collections import LineCollectionfrom matplotlib.ticker import MultipleLocatorfig = plt.figure("MRI_with_EEG")# Load the MRI data (256x256 16 bit integers)with cbook.get_sample_data('s1045.ima.gz') as dfile:im = np.fromstring(dfile.read(), np.uint16).reshape((256, 256))# Plot the MRI imageax0 = fig.add_subplot(2, 2, 1)ax0.imshow(im, cmap=cm.gray)ax0.axis('off')# Plot the histogram of MRI intensityax1 = fig.add_subplot(2, 2, 2)im = np.ravel(im)im = im[np.nonzero(im)] # Ignore the backgroundim = im / (2**16 - 1) # Normalizeax1.hist(im, bins=100)ax1.xaxis.set_major_locator(MultipleLocator(0.4))ax1.minorticks_on()ax1.set_yticks([])ax1.set_xlabel('Intensity (a.u.)')ax1.set_ylabel('MRI density')# Load the EEG datan_samples, n_rows = 800, 4with cbook.get_sample_data('eeg.dat') as eegfile:data = np.fromfile(eegfile, dtype=float).reshape((n_samples, n_rows))t = 10 * np.arange(n_samples) / n_samples# Plot the EEGticklocs = []ax2 = fig.add_subplot(2, 1, 2)ax2.set_xlim(0, 10)ax2.set_xticks(np.arange(10))dmin = data.min()dmax = data.max()dr = (dmax - dmin) * 0.7 # Crowd them a bit.y0 = dminy1 = (n_rows - 1) * dr + dmaxax2.set_ylim(y0, y1)segs = []for i in range(n_rows):segs.append(np.column_stack((t, data[:, i])))ticklocs.append(i * dr)offsets = np.zeros((n_rows, 2), dtype=float)offsets[:, 1] = ticklocslines = LineCollection(segs, offsets=offsets, transOffset=None)ax2.add_collection(lines)# Set the yticks to use axes coordinates on the y axisax2.set_yticks(ticklocs)ax2.set_yticklabels(['PG3', 'PG5', 'PG7', 'PG9'])ax2.set_xlabel('Time (s)')plt.tight_layout()plt.show()
下载这个示例

若有收获,就点个赞吧
0 人点赞
