使用GridSpec制作多列/行子图布局
GridSpec是布置子打印网格的一种灵活方式。下面是一个使用3x3网格和横跨所有三列、两列和两行的轴的示例。
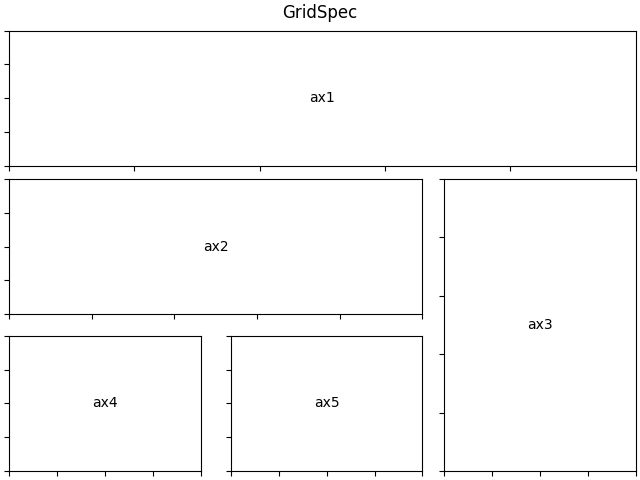
import matplotlib.pyplot as pltfrom matplotlib.gridspec import GridSpecdef format_axes(fig):for i, ax in enumerate(fig.axes):ax.text(0.5, 0.5, "ax%d" % (i+1), va="center", ha="center")ax.tick_params(labelbottom=False, labelleft=False)fig = plt.figure(constrained_layout=True)gs = GridSpec(3, 3, figure=fig)ax1 = fig.add_subplot(gs[0, :])# identical to ax1 = plt.subplot(gs.new_subplotspec((0, 0), colspan=3))ax2 = fig.add_subplot(gs[1, :-1])ax3 = fig.add_subplot(gs[1:, -1])ax4 = fig.add_subplot(gs[-1, 0])ax5 = fig.add_subplot(gs[-1, -2])fig.suptitle("GridSpec")format_axes(fig)plt.show()
下载这个示例

若有收获,就点个赞吧
0 人点赞
