填充线条之间的区域
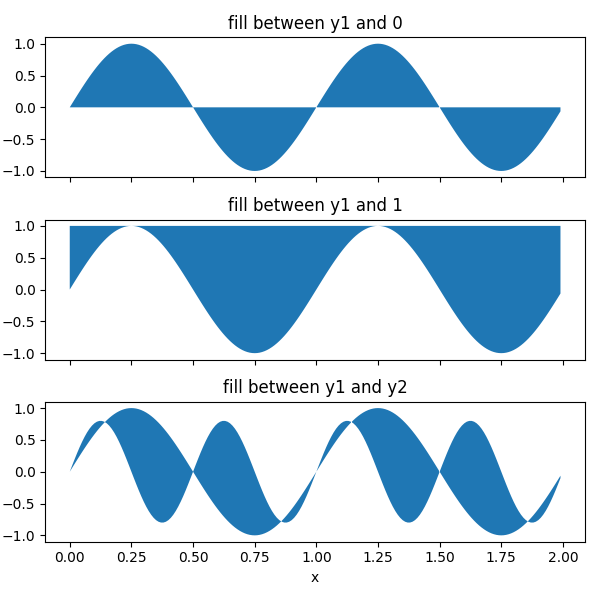
此示例显示如何使用fill_between方法基于用户定义的逻辑在行之间着色。
import matplotlib.pyplot as pltimport numpy as npx = np.arange(0.0, 2, 0.01)y1 = np.sin(2 * np.pi * x)y2 = 1.2 * np.sin(4 * np.pi * x)
fig, (ax1, ax2, ax3) = plt.subplots(3, 1, sharex=True)ax1.fill_between(x, 0, y1)ax1.set_ylabel('between y1 and 0')ax2.fill_between(x, y1, 1)ax2.set_ylabel('between y1 and 1')ax3.fill_between(x, y1, y2)ax3.set_ylabel('between y1 and y2')ax3.set_xlabel('x')
现在在满足逻辑条件的y1和y2之间填充。 请注意,这与调用fill_between(x[where], y1[where], y2[where]…)不同,因为多个连续区域的边缘效应。
fig, (ax, ax1) = plt.subplots(2, 1, sharex=True)ax.plot(x, y1, x, y2, color='black')ax.fill_between(x, y1, y2, where=y2 >= y1, facecolor='green', interpolate=True)ax.fill_between(x, y1, y2, where=y2 <= y1, facecolor='red', interpolate=True)ax.set_title('fill between where')# Test support for masked arrays.y2 = np.ma.masked_greater(y2, 1.0)ax1.plot(x, y1, x, y2, color='black')ax1.fill_between(x, y1, y2, where=y2 >= y1,facecolor='green', interpolate=True)ax1.fill_between(x, y1, y2, where=y2 <= y1,facecolor='red', interpolate=True)ax1.set_title('Now regions with y2>1 are masked')
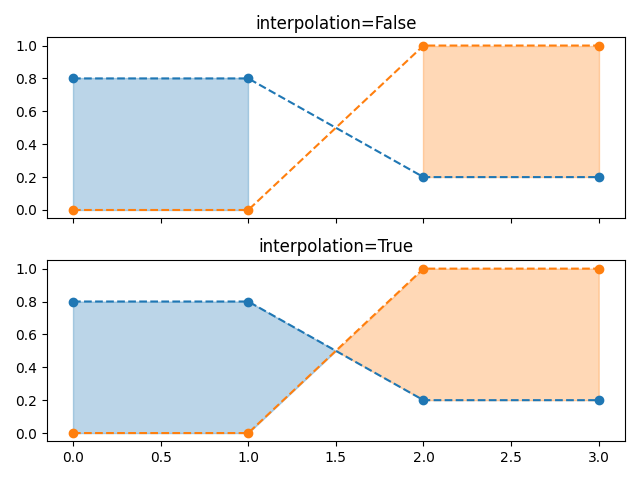
这个例子说明了一个问题; 由于数据网格化,在交叉点处存在不期望的未填充三角形。 蛮力解决方案是在绘图之前将所有阵列插值到非常精细的网格。
使用变换创建满足特定条件的轴跨度:
fig, ax = plt.subplots()y = np.sin(4 * np.pi * x)ax.plot(x, y, color='black')# use data coordinates for the x-axis and the axes coordinates for the y-axisimport matplotlib.transforms as mtransformstrans = mtransforms.blended_transform_factory(ax.transData, ax.transAxes)theta = 0.9ax.axhline(theta, color='green', lw=2, alpha=0.5)ax.axhline(-theta, color='red', lw=2, alpha=0.5)ax.fill_between(x, 0, 1, where=y > theta,facecolor='green', alpha=0.5, transform=trans)ax.fill_between(x, 0, 1, where=y < -theta,facecolor='red', alpha=0.5, transform=trans)plt.show()
下载这个示例

若有收获,就点个赞吧
0 人点赞
