日期索引格式化程序
在绘制每日数据时,频繁的请求是绘制忽略跳过的数据,例如,周末没有额外的空格。这在金融时间序列中尤为常见,因为您可能拥有M-F而非Sat,Sun的数据,并且您不需要x轴上的间隙。方法是简单地使用xdata的整数索引和自定义刻度Formatter来获取给定索引的适当日期字符串。
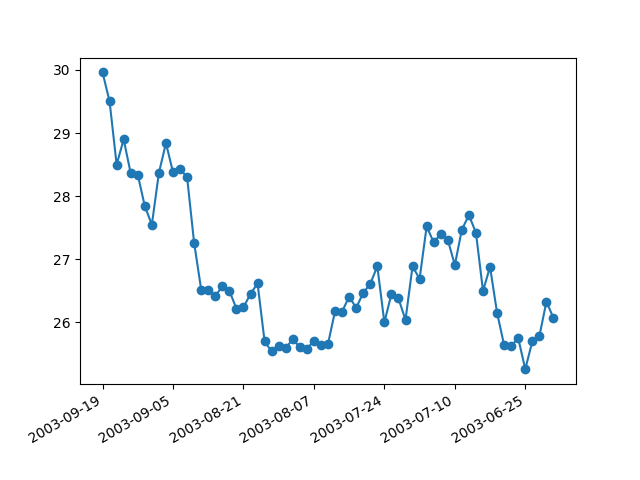
输出:
loading /home/tcaswell/mc3/envs/dd37/lib/python3.7/site-packages/matplotlib/mpl-data/sample_data/msft.csv
import numpy as npimport matplotlib.pyplot as pltimport matplotlib.cbook as cbookfrom matplotlib.dates import bytespdate2num, num2datefrom matplotlib.ticker import Formatterdatafile = cbook.get_sample_data('msft.csv', asfileobj=False)print('loading %s' % datafile)msft_data = np.genfromtxt(datafile, delimiter=',', names=True,converters={0: bytespdate2num('%d-%b-%y')})[-40:]class MyFormatter(Formatter):def __init__(self, dates, fmt='%Y-%m-%d'):self.dates = datesself.fmt = fmtdef __call__(self, x, pos=0):'Return the label for time x at position pos'ind = int(np.round(x))if ind >= len(self.dates) or ind < 0:return ''return num2date(self.dates[ind]).strftime(self.fmt)formatter = MyFormatter(msft_data['Date'])fig, ax = plt.subplots()ax.xaxis.set_major_formatter(formatter)ax.plot(np.arange(len(msft_data)), msft_data['Close'], 'o-')fig.autofmt_xdate()plt.show()
下载这个示例

若有收获,就点个赞吧
0 人点赞
