图例选择
启用图例上的拾取以打开和关闭原始线。
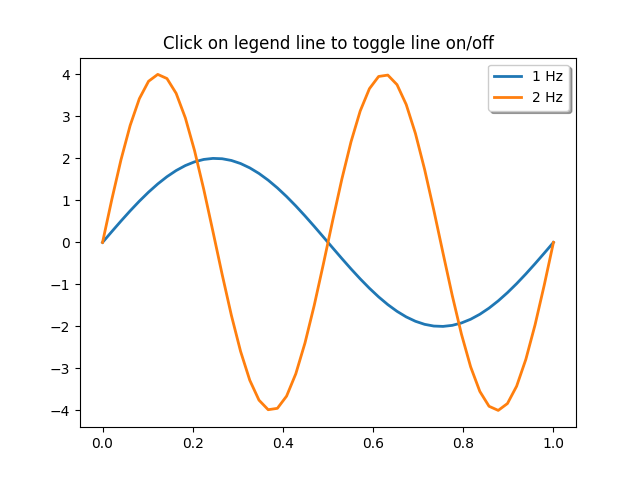
import numpy as npimport matplotlib.pyplot as pltt = np.arange(0.0, 0.2, 0.1)y1 = 2*np.sin(2*np.pi*t)y2 = 4*np.sin(2*np.pi*2*t)fig, ax = plt.subplots()ax.set_title('Click on legend line to toggle line on/off')line1, = ax.plot(t, y1, lw=2, color='red', label='1 HZ')line2, = ax.plot(t, y2, lw=2, color='blue', label='2 HZ')leg = ax.legend(loc='upper left', fancybox=True, shadow=True)leg.get_frame().set_alpha(0.4)# we will set up a dict mapping legend line to orig line, and enable# picking on the legend linelines = [line1, line2]lined = dict()for legline, origline in zip(leg.get_lines(), lines):legline.set_picker(5) # 5 pts tolerancelined[legline] = origlinedef onpick(event):# on the pick event, find the orig line corresponding to the# legend proxy line, and toggle the visibilitylegline = event.artistorigline = lined[legline]vis = not origline.get_visible()origline.set_visible(vis)# Change the alpha on the line in the legend so we can see what lines# have been toggledif vis:legline.set_alpha(1.0)else:legline.set_alpha(0.2)fig.canvas.draw()fig.canvas.mpl_connect('pick_event', onpick)plt.show()
下载这个示例

若有收获,就点个赞吧
0 人点赞
