绘制分类变量
如何在Matplotlib中使用分类变量。
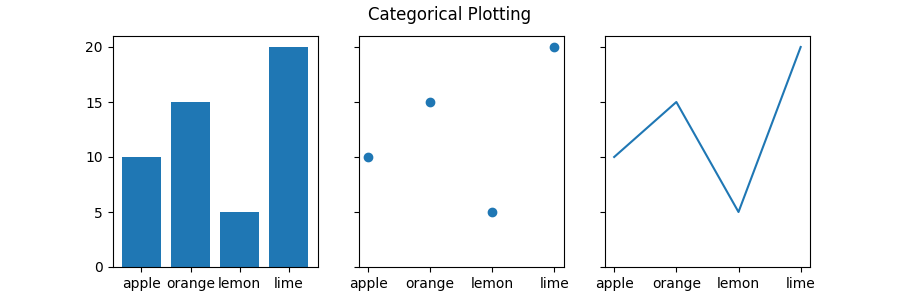
很多时候你想创建一个在Matplotlib中使用分类变量的图。Matplotlib允许你将分类变量直接传递给许多绘图函数,我们将在下面演示。
import matplotlib.pyplot as pltdata = {'apples': 10, 'oranges': 15, 'lemons': 5, 'limes': 20}names = list(data.keys())values = list(data.values())fig, axs = plt.subplots(1, 3, figsize=(9, 3), sharey=True)axs[0].bar(names, values)axs[1].scatter(names, values)axs[2].plot(names, values)fig.suptitle('Categorical Plotting')
 ;
;
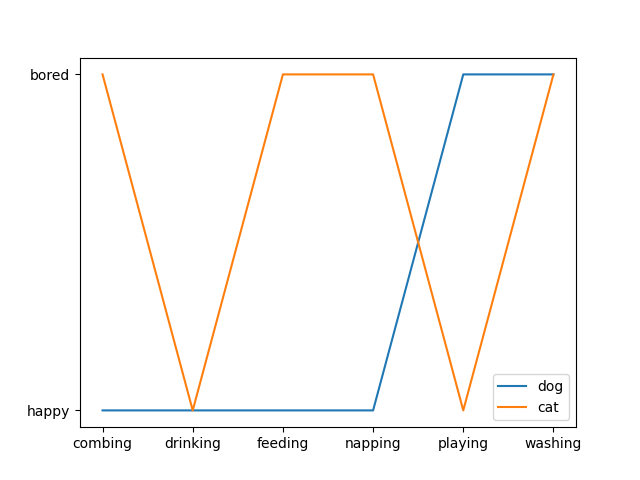
这在两个轴上都起作用:
cat = ["bored", "happy", "bored", "bored", "happy", "bored"]dog = ["happy", "happy", "happy", "happy", "bored", "bored"]activity = ["combing", "drinking", "feeding", "napping", "playing", "washing"]fig, ax = plt.subplots()ax.plot(activity, dog, label="dog")ax.plot(activity, cat, label="cat")ax.legend()plt.show()
 ;
;
下载这个示例

若有收获,就点个赞吧
0 人点赞
