三维体素绘制Numpy的Logo
演示使用坐标不均匀的ax.voxels
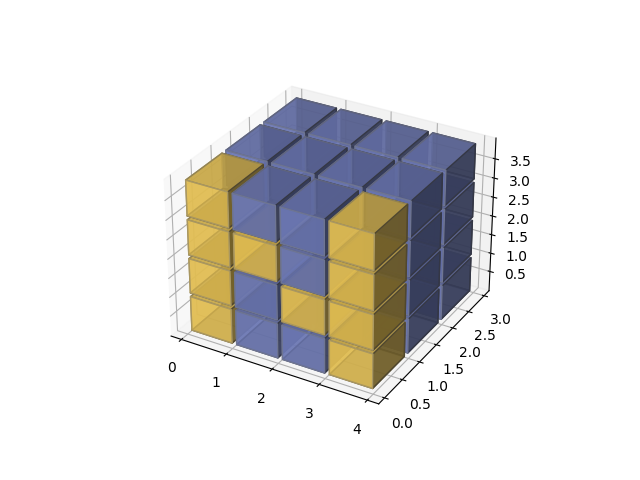
import matplotlib.pyplot as pltimport numpy as np# This import registers the 3D projection, but is otherwise unused.from mpl_toolkits.mplot3d import Axes3D # noqa: F401 unused importdef explode(data):size = np.array(data.shape)*2data_e = np.zeros(size - 1, dtype=data.dtype)data_e[::2, ::2, ::2] = datareturn data_e# build up the numpy logon_voxels = np.zeros((4, 3, 4), dtype=bool)n_voxels[0, 0, :] = Truen_voxels[-1, 0, :] = Truen_voxels[1, 0, 2] = Truen_voxels[2, 0, 1] = Truefacecolors = np.where(n_voxels, '#FFD65DC0', '#7A88CCC0')edgecolors = np.where(n_voxels, '#BFAB6E', '#7D84A6')filled = np.ones(n_voxels.shape)# upscale the above voxel image, leaving gapsfilled_2 = explode(filled)fcolors_2 = explode(facecolors)ecolors_2 = explode(edgecolors)# Shrink the gapsx, y, z = np.indices(np.array(filled_2.shape) + 1).astype(float) // 2x[0::2, :, :] += 0.05y[:, 0::2, :] += 0.05z[:, :, 0::2] += 0.05x[1::2, :, :] += 0.95y[:, 1::2, :] += 0.95z[:, :, 1::2] += 0.95fig = plt.figure()ax = fig.gca(projection='3d')ax.voxels(x, y, z, filled_2, facecolors=fcolors_2, edgecolors=ecolors_2)plt.show()
下载这个示例

若有收获,就点个赞吧
0 人点赞
