误差条形图的不同方法
可以将错误指定为常数值(如errorbar_demo.py中所示)。但是,此示例通过指定错误值数组来演示它们的不同之处。
如果原始x和y数据的长度为N,则有两个选项:
- 数组形状为(N,): 每个点的误差都不同,但误差值是对称的(即,上下两个值相等)。
- 数组形状为(2, N): 每个点的误差不同,并且下限和上限(按该顺序)不同(非对称情况)。
此外,此示例演示如何使用带有误差线的对数刻度。
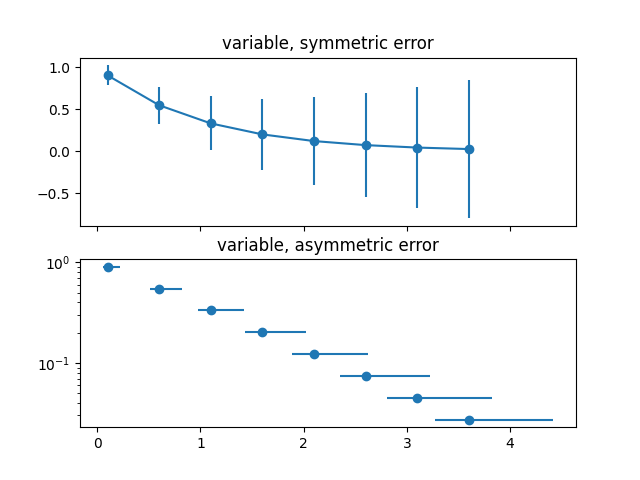
import numpy as npimport matplotlib.pyplot as plt# example datax = np.arange(0.1, 4, 0.5)y = np.exp(-x)# example error bar values that vary with x-positionerror = 0.1 + 0.2 * xfig, (ax0, ax1) = plt.subplots(nrows=2, sharex=True)ax0.errorbar(x, y, yerr=error, fmt='-o')ax0.set_title('variable, symmetric error')# error bar values w/ different -/+ errors that# also vary with the x-positionlower_error = 0.4 * errorupper_error = errorasymmetric_error = [lower_error, upper_error]ax1.errorbar(x, y, xerr=asymmetric_error, fmt='o')ax1.set_title('variable, asymmetric error')ax1.set_yscale('log')plt.show()
下载这个示例

若有收获,就点个赞吧
0 人点赞
