Pyplot 比例尺(Scales)
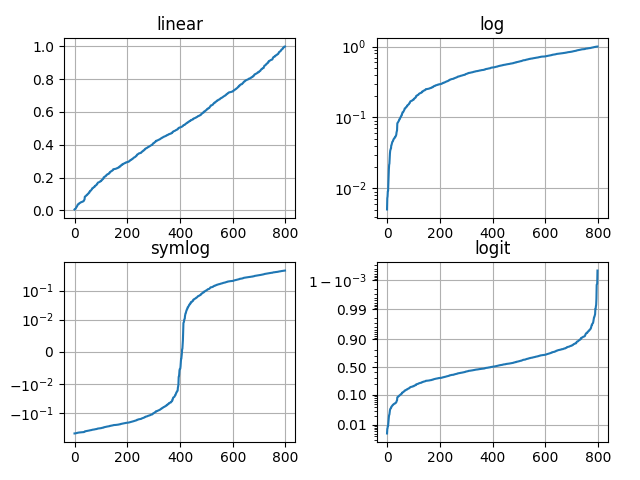
在不同的比例上创建图。这里显示了线性,对数,对称对数和对数标度。有关更多示例,请参阅库的“缩放”部分。
import numpy as npimport matplotlib.pyplot as pltfrom matplotlib.ticker import NullFormatter # useful for `logit` scale# Fixing random state for reproducibilitynp.random.seed(19680801)# make up some data in the interval ]0, 1[y = np.random.normal(loc=0.5, scale=0.4, size=1000)y = y[(y > 0) & (y < 1)]y.sort()x = np.arange(len(y))# plot with various axes scalesplt.figure(1)# linearplt.subplot(221)plt.plot(x, y)plt.yscale('linear')plt.title('linear')plt.grid(True)# logplt.subplot(222)plt.plot(x, y)plt.yscale('log')plt.title('log')plt.grid(True)# symmetric logplt.subplot(223)plt.plot(x, y - y.mean())plt.yscale('symlog', linthreshy=0.01)plt.title('symlog')plt.grid(True)# logitplt.subplot(224)plt.plot(x, y)plt.yscale('logit')plt.title('logit')plt.grid(True)# Format the minor tick labels of the y-axis into empty strings with# `NullFormatter`, to avoid cumbering the axis with too many labels.plt.gca().yaxis.set_minor_formatter(NullFormatter())# Adjust the subplot layout, because the logit one may take more space# than usual, due to y-tick labels like "1 - 10^{-3}"plt.subplots_adjust(top=0.92, bottom=0.08, left=0.10, right=0.95, hspace=0.25,wspace=0.35)plt.show()
参考
此示例中显示了以下函数,方法,类和模块的使用:
import matplotlibmatplotlib.pyplot.subplotmatplotlib.pyplot.subplots_adjustmatplotlib.pyplot.gcamatplotlib.pyplot.yscalematplotlib.ticker.NullFormattermatplotlib.axis.Axis.set_minor_formatter
下载这个示例

若有收获,就点个赞吧
0 人点赞
