插入定位器演示
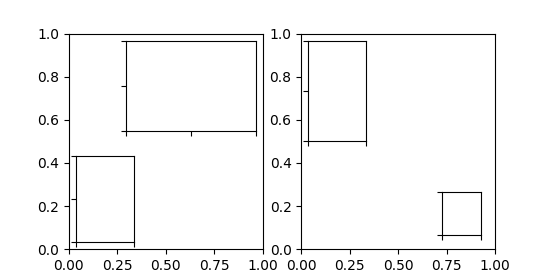
inset_locator 的 inset_axes 允许通过指定宽度和高度以及可选地将位置(Loc)接受位置作为代码(类似于图例),轻松地在轴的角中放置插入。默认情况下,通过“边界板”(BorderPad)参数控制的内嵌与轴之间的某些点偏移。
import matplotlib.pyplot as pltfrom mpl_toolkits.axes_grid1.inset_locator import inset_axesfig, (ax, ax2) = plt.subplots(1, 2, figsize=[5.5, 2.8])# Create inset of width 1.3 inches and height 0.9 inches# at the default upper right locationaxins = inset_axes(ax, width=1.3, height=0.9)# Create inset of width 30% and height 40% of the parent axes' bounding box# at the lower left corner (loc=3)axins2 = inset_axes(ax, width="30%", height="40%", loc=3)# Create inset of mixed specifications in the second subplot;# width is 30% of parent axes' bounding box and# height is 1 inch at the upper left corner (loc=2)axins3 = inset_axes(ax2, width="30%", height=1., loc=2)# Create an inset in the lower right corner (loc=4) with borderpad=1, i.e.# 10 points padding (as 10pt is the default fontsize) to the parent axesaxins4 = inset_axes(ax2, width="20%", height="20%", loc=4, borderpad=1)# Turn ticklabels of insets offfor axi in [axins, axins2, axins3, axins4]:axi.tick_params(labelleft=False, labelbottom=False)plt.show()
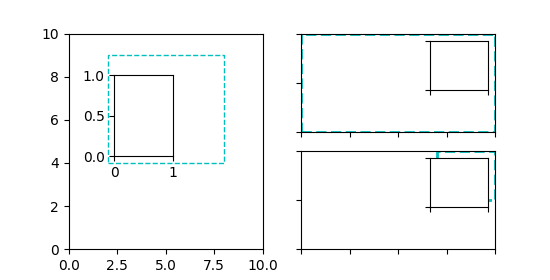
参数bbox_to_anchor 和 bbox_transfrom 可用于对插入位置和大小进行更细粒度的控制,甚至可以将插入位置置于完全任意位置。bbox_to_anchor 根据 bbox_transform 设置坐标中的边界框。
fig = plt.figure(figsize=[5.5, 2.8])ax = fig.add_subplot(121)# We use the axes transform as bbox_transform. Therefore the bounding box# needs to be specified in axes coordinates ((0,0) is the lower left corner# of the axes, (1,1) is the upper right corner).# The bounding box (.2, .4, .6, .5) starts at (.2,.4) and ranges to (.8,.9)# in those coordinates.# Inside of this bounding box an inset of half the bounding box' width and# three quarters of the bounding box' height is created. The lower left corner# of the inset is aligned to the lower left corner of the bounding box (loc=3).# The inset is then offset by the default 0.5 in units of the font size.axins = inset_axes(ax, width="50%", height="75%",bbox_to_anchor=(.2, .4, .6, .5),bbox_transform=ax.transAxes, loc=3)# For visualization purposes we mark the bounding box by a rectangleax.add_patch(plt.Rectangle((.2, .4), .6, .5, ls="--", ec="c", fc="None",transform=ax.transAxes))# We set the axis limits to something other than the default, in order to not# distract from the fact that axes coodinates are used here.ax.axis([0, 10, 0, 10])# Note how the two following insets are created at the same positions, one by# use of the default parent axes' bbox and the other via a bbox in axes# coordinates and the respective transform.ax2 = fig.add_subplot(222)axins2 = inset_axes(ax2, width="30%", height="50%")ax3 = fig.add_subplot(224)axins3 = inset_axes(ax3, width="100%", height="100%",bbox_to_anchor=(.7, .5, .3, .5),bbox_transform=ax3.transAxes)# For visualization purposes we mark the bounding box by a rectangleax2.add_patch(plt.Rectangle((0, 0), 1, 1, ls="--", lw=2, ec="c", fc="None"))ax3.add_patch(plt.Rectangle((.7, .5), .3, .5, ls="--", lw=2,ec="c", fc="None"))# Turn ticklabels offfor axi in [axins2, axins3, ax2, ax3]:axi.tick_params(labelleft=False, labelbottom=False)plt.show()
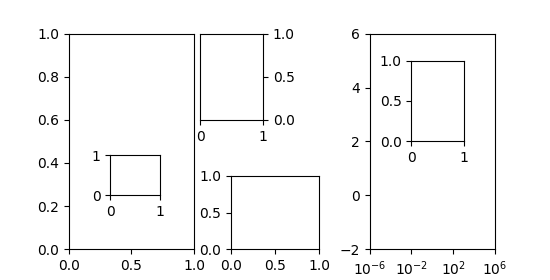
在上述方法中,使用了轴变换和4元组边界框,因为它主要用于指定相对于其所插入的轴的插入值。但是,其他用例也是可能的。下面的示例检查其中一些。
fig = plt.figure(figsize=[5.5, 2.8])ax = fig.add_subplot(131)# Create an inset outside the axesaxins = inset_axes(ax, width="100%", height="100%",bbox_to_anchor=(1.05, .6, .5, .4),bbox_transform=ax.transAxes, loc=2, borderpad=0)axins.tick_params(left=False, right=True, labelleft=False, labelright=True)# Create an inset with a 2-tuple bounding box. Note that this creates a# bbox without extent. This hence only makes sense when specifying# width and height in absolute units (inches).axins2 = inset_axes(ax, width=0.5, height=0.4,bbox_to_anchor=(0.33, 0.25),bbox_transform=ax.transAxes, loc=3, borderpad=0)ax2 = fig.add_subplot(133)ax2.set_xscale("log")ax2.axis([1e-6, 1e6, -2, 6])# Create inset in data coordinates using ax.transData as transformaxins3 = inset_axes(ax2, width="100%", height="100%",bbox_to_anchor=(1e-2, 2, 1e3, 3),bbox_transform=ax2.transData, loc=2, borderpad=0)# Create an inset horizontally centered in figure coordinates and vertically# bound to line up with the axes.from matplotlib.transforms import blended_transform_factorytransform = blended_transform_factory(fig.transFigure, ax2.transAxes)axins4 = inset_axes(ax2, width="16%", height="34%",bbox_to_anchor=(0, 0, 1, 1),bbox_transform=transform, loc=8, borderpad=0)plt.show()
下载这个示例

若有收获,就点个赞吧
0 人点赞
