简单Coord01注释示例
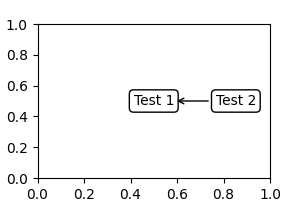
import matplotlib.pyplot as pltfig, ax = plt.subplots(figsize=(3, 2))an1 = ax.annotate("Test 1", xy=(0.5, 0.5), xycoords="data",va="center", ha="center",bbox=dict(boxstyle="round", fc="w"))an2 = ax.annotate("Test 2", xy=(1, 0.5), xycoords=an1,xytext=(30, 0), textcoords="offset points",va="center", ha="left",bbox=dict(boxstyle="round", fc="w"),arrowprops=dict(arrowstyle="->"))plt.show()
下载这个示例

若有收获,就点个赞吧
0 人点赞
