Contourf 与记录颜色刻度
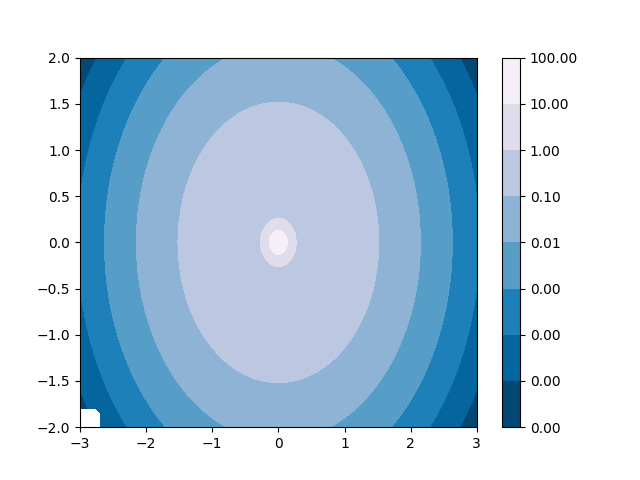
演示在 Contourf 中记录颜色的标度
import matplotlib.pyplot as pltimport numpy as npfrom numpy import mafrom matplotlib import ticker, cmN = 100x = np.linspace(-3.0, 3.0, N)y = np.linspace(-2.0, 2.0, N)X, Y = np.meshgrid(x, y)# A low hump with a spike coming out.# Needs to have z/colour axis on a log scale so we see both hump and spike.# linear scale only shows the spike.Z1 = np.exp(-(X)**2 - (Y)**2)Z2 = np.exp(-(X * 10)**2 - (Y * 10)**2)z = Z1 + 50 * Z2# Put in some negative values (lower left corner) to cause trouble with logs:z[:5, :5] = -1# The following is not strictly essential, but it will eliminate# a warning. Comment it out to see the warning.z = ma.masked_where(z <= 0, z)# Automatic selection of levels works; setting the# log locator tells contourf to use a log scale:fig, ax = plt.subplots()cs = ax.contourf(X, Y, z, locator=ticker.LogLocator(), cmap=cm.PuBu_r)# Alternatively, you can manually set the levels# and the norm:# lev_exp = np.arange(np.floor(np.log10(z.min())-1),# np.ceil(np.log10(z.max())+1))# levs = np.power(10, lev_exp)# cs = ax.contourf(X, Y, z, levs, norm=colors.LogNorm())cbar = fig.colorbar(cs)plt.show()
参考
本例中显示了以下函数、方法和类的使用:
import matplotlibmatplotlib.axes.Axes.contourfmatplotlib.pyplot.contourfmatplotlib.figure.Figure.colorbarmatplotlib.pyplot.colorbarmatplotlib.axes.Axes.legendmatplotlib.pyplot.legendmatplotlib.ticker.LogLocator
下载这个示例

若有收获,就点个赞吧
0 人点赞
