双对数
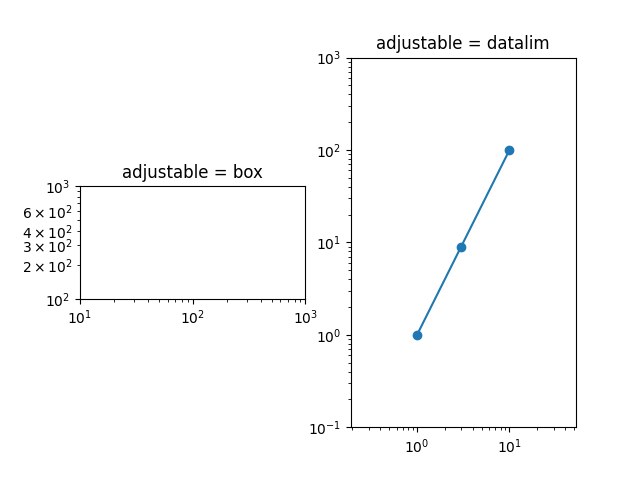
import matplotlib.pyplot as pltfig, (ax1, ax2) = plt.subplots(1, 2)ax1.set_xscale("log")ax1.set_yscale("log")ax1.set_xlim(1e1, 1e3)ax1.set_ylim(1e2, 1e3)ax1.set_aspect(1)ax1.set_title("adjustable = box")ax2.set_xscale("log")ax2.set_yscale("log")ax2.set_adjustable("datalim")ax2.plot([1, 3, 10], [1, 9, 100], "o-")ax2.set_xlim(1e-1, 1e2)ax2.set_ylim(1e-1, 1e3)ax2.set_aspect(1)ax2.set_title("adjustable = datalim")plt.show()
下载这个示例

若有收获,就点个赞吧
0 人点赞
