Boxplot 演示
boxplot 的代码示例。
import numpy as npimport matplotlib.pyplot as plt# Fixing random state for reproducibilitynp.random.seed(19680801)# fake up some dataspread = np.random.rand(50) * 100center = np.ones(25) * 50flier_high = np.random.rand(10) * 100 + 100flier_low = np.random.rand(10) * -100data = np.concatenate((spread, center, flier_high, flier_low))
fig1, ax1 = plt.subplots()ax1.set_title('Basic Plot')ax1.boxplot(data)
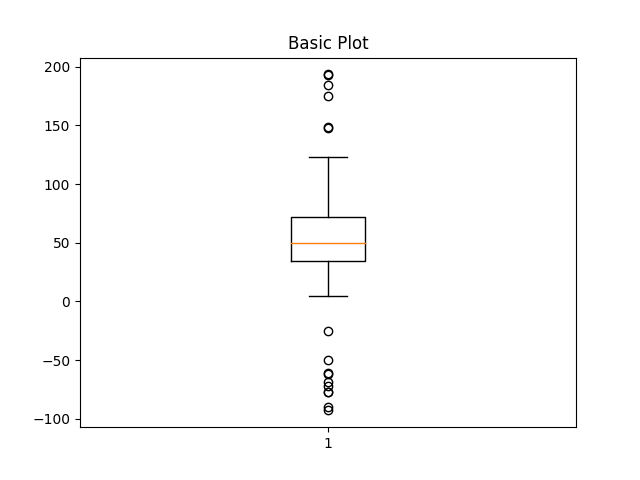
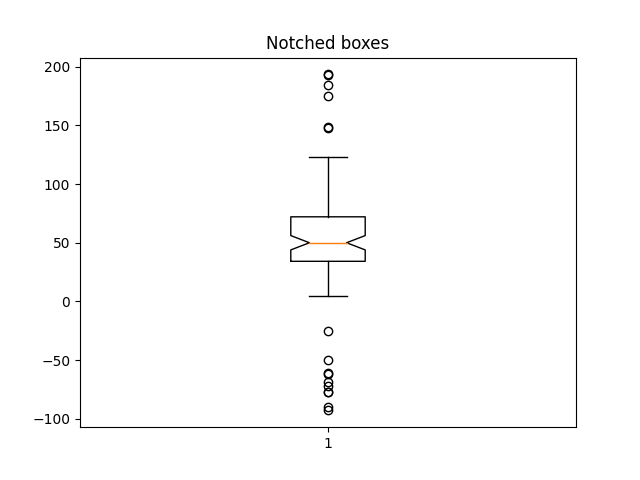
fig2, ax2 = plt.subplots()ax2.set_title('Notched boxes')ax2.boxplot(data, notch=True)
green_diamond = dict(markerfacecolor='g', marker='D')fig3, ax3 = plt.subplots()ax3.set_title('Changed Outlier Symbols')ax3.boxplot(data, flierprops=green_diamond)
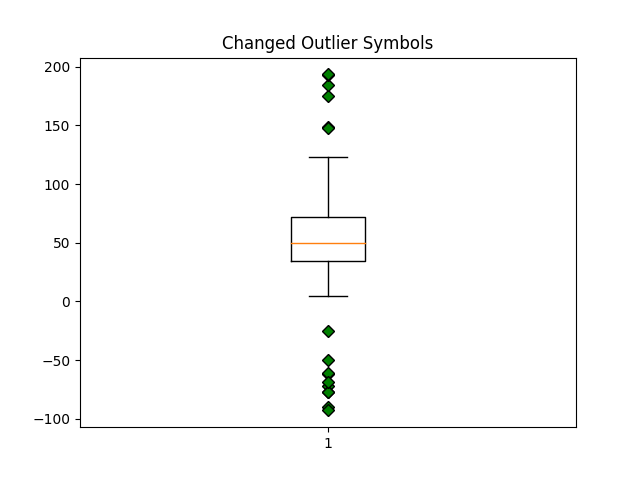
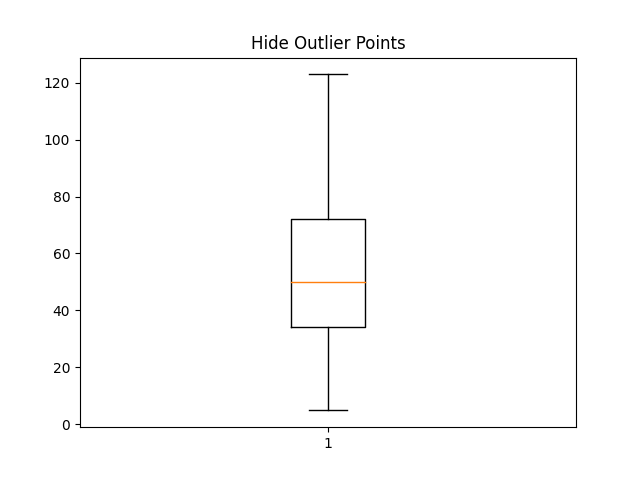
fig4, ax4 = plt.subplots()ax4.set_title('Hide Outlier Points')ax4.boxplot(data, showfliers=False)
red_square = dict(markerfacecolor='r', marker='s')fig5, ax5 = plt.subplots()ax5.set_title('Horizontal Boxes')ax5.boxplot(data, vert=False, flierprops=red_square)
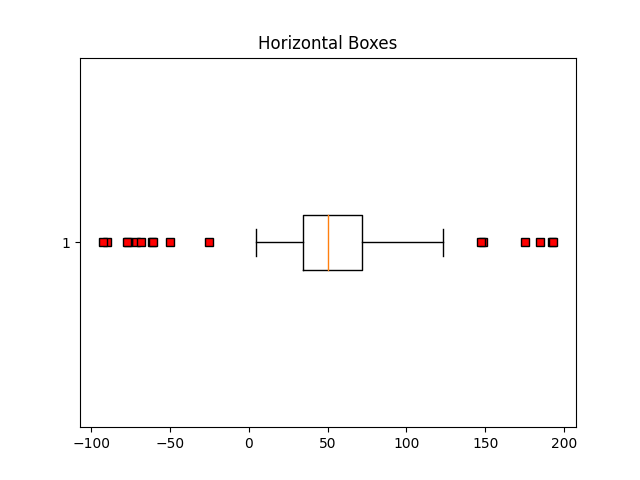
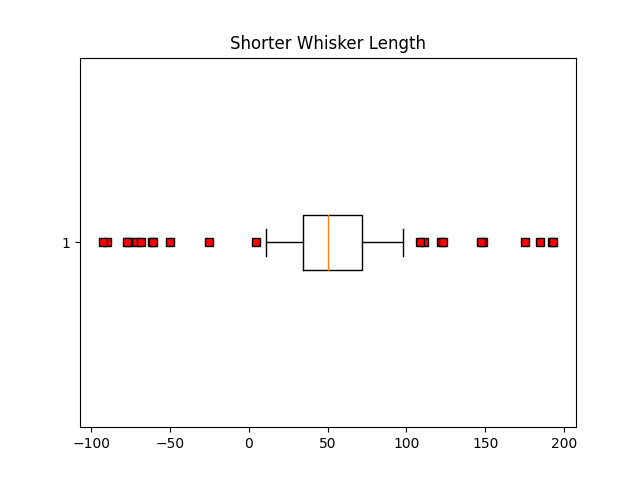
fig6, ax6 = plt.subplots()ax6.set_title('Shorter Whisker Length')ax6.boxplot(data, flierprops=red_square, vert=False, whis=0.75)
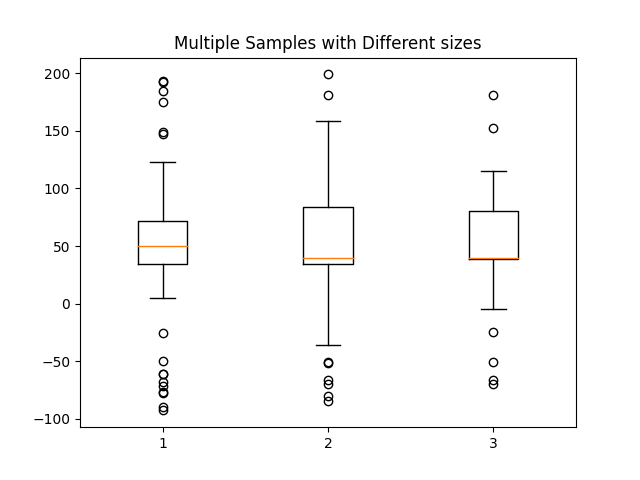
模拟一些更多的数据。
spread = np.random.rand(50) * 100center = np.ones(25) * 40flier_high = np.random.rand(10) * 100 + 100flier_low = np.random.rand(10) * -100d2 = np.concatenate((spread, center, flier_high, flier_low))data.shape = (-1, 1)d2.shape = (-1, 1)
仅当所有列的长度相同时,才能生成二维数组。 如果不是,则使用列表。 这实际上更有效,因为boxplot无论如何都会在内部将2-D数组转换为向量列表。
data = [data, d2, d2[::2,0]]fig7, ax7 = plt.subplots()ax7.set_title('Multiple Samples with Different sizes')ax7.boxplot(data)plt.show()
参考
此示例中显示了以下函数,方法,类和模块的使用:
import matplotlibmatplotlib.axes.Axes.boxplotmatplotlib.pyplot.boxplot
下载这个示例

若有收获,就点个赞吧
0 人点赞
