官网 https://matplotlib.org/
中文文档 https://matplotlib.org.cn/
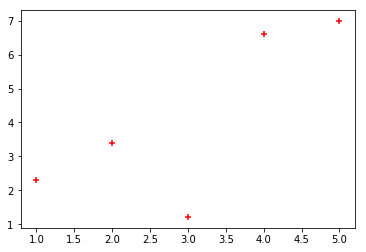
第一个图
import matplotlib.pyplot as plt # 导入库x = [1, 2, 3, 4, 5] # 定义x轴的值y = [2.3, 3.4, 1.2, 6.6, 7.0] # 定义y轴的值plt.scatter(x, y, color='r', marker='+') # 创建了一个散点图plt.show()
画布

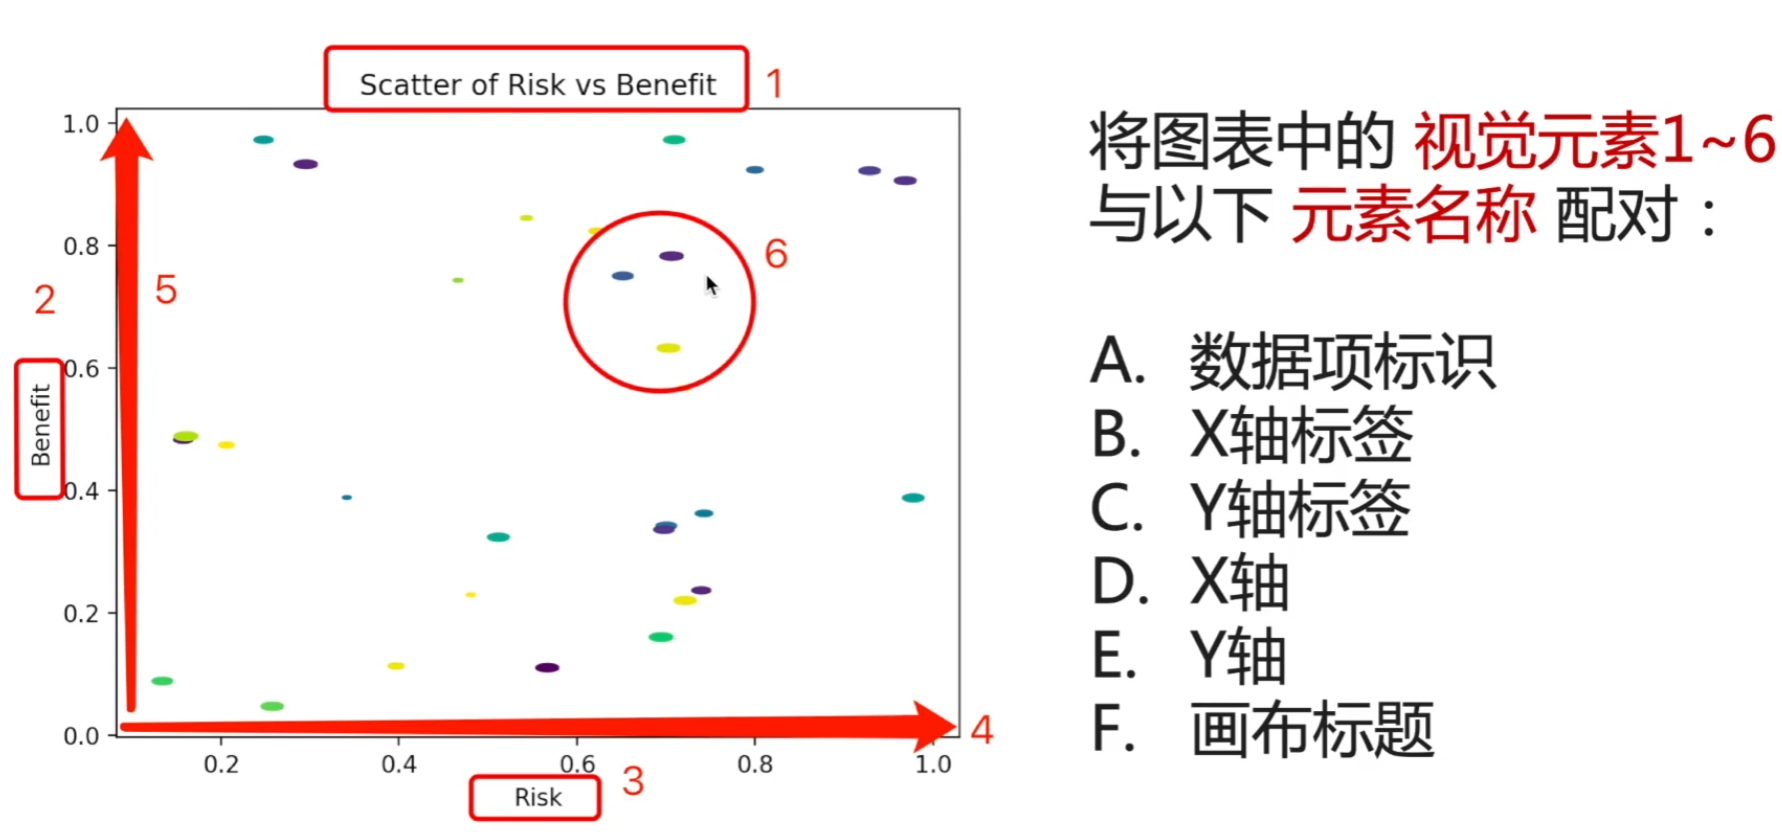
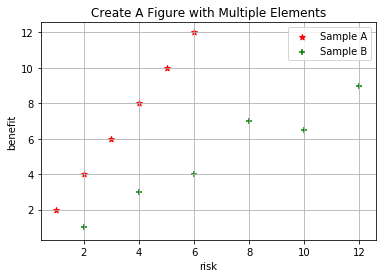
# 画布(单图可省略)# plt.figure()# x轴,y轴x = [1, 2, 3, 4, 5, 6]y = [2, 4, 6, 8, 10, 12]x2 = [2, 4, 6, 8, 10, 12]y2 = [1, 3, 4, 7, 6.5, 9]# 轴标签plt.xlabel("risk")plt.ylabel("benefit")# 标题plt.title("Create A Figure with Multiple Elements")# 数据项标识:形状、颜色plt.scatter(x=x, y=y, marker='*', color='red', label='Sample A')plt.scatter(x=x2, y=y2, marker='+', color='green', label='Sample B')# 网格plt.grid(True) # True:显示网格# 注释说明plt.legend()# 主副刻度标签# plt.xticks(ticks=[0, 4, 8, 12])# plt.yticks(ticks=[0, 3, 6, 9, 12])# plt.minorticks_on()# 展示plt.show()

若有收获,就点个赞吧
0 人点赞
