一、Spring cloud应用改动
(1)、加入依赖
<dependency><groupId>org.springframework.boot</groupId><artifactId>spring-boot-starter-actuator</artifactId></dependency><dependency><groupId>io.prometheus</groupId><artifactId>simpleclient_spring_boot</artifactId><version>0.0.26</version></dependency>
(2)、修改Application类:加入@EnablePrometheusEndpoint和@EnableSpringBootMetricsCollector注解
@SpringBootApplication@EnableDiscoveryClient@EnablePrometheusEndpoint@EnableSpringBootMetricsCollectorpublic class AuthApplication {public static void main(String[] args) {SpringApplication.run(AuthApplication.class, args);}}
- 修改application.yml:
security:basic:enabled: falsemanagement:security:enabled: false
我这是为了方便,禁用了相关安全认证选项,你可不要把这个配置应用到生产环境,不然你就要背锅咯
接着启动你的应用,打开浏览器输入http://localhost:2222/auth/prometheus,正常情况下你就可以在页面上看到很多键值对:
key value.png
就像这样。
Prometheus:
- 安装:
去官网下载,根据你自己的操作系统选择版本,我这本地测试玩,就弄了个windows版本下的。下载完,解压,找到prometheus.yml改配置:
# my global configglobal:scrape_interval: 15s # Set the scrape interval to every 15 seconds. Default is every 1 minute.evaluation_interval: 15s # Evaluate rules every 15 seconds. The default is every 1 minute.# scrape_timeout is set to the global default (10s).# Attach these labels to any time series or alerts when communicating with# external systems (federation, remote storage, Alertmanager).external_labels:monitor: 'codelab-monitor'# Load rules once and periodically evaluate them according to the global 'evaluation_interval'.rule_files:# - "first.rules"# - "second.rules"# A scrape configuration containing exactly one endpoint to scrape:# Here it's Prometheus itself.scrape_configs:- job_name: auth-servicescrape_interval: 5sscrape_timeout: 5smetrics_path: /auth/prometheusscheme: httpstatic_configs:- targets:- 127.0.0.1:2222
这个是我自己的配置,你根据需要更改为你的应用合适的配置,主要更改在scrape_configs节点下。
- 启动Prometheus:
windows下,进入命令行模式,进入到Prometheus的目录中,运行prometheus -config.file=prometheus.yml,启动成功后,在http://localhost:9090/targets你会看到你所监控的目标,但在这里,你会发现居然有错:

error.png
然后Google一下,发现了这个https://github.com/prometheus/client_java/issues/130简直一模一样啊,莫非有救了,淡定,实际上并没有救,你会见证Prometheus client_java项目组和spring boot以及spring cloud项目组之间的互相扯皮踢皮球,最后我只好用了个暂且有用的办法,就是去掉那些产生问题的指标,在你的Spring boot应用配置文件中加上:
spring:application:name: auth##去除有问题的指标,因为指标名重复产生bugmetrics:servo:enabled: falseserver:port: 2222context-path: /autheureka:client:serviceUrl:defaultZone: http://localhost:1111/eureka/instance:prefer-ip-address: truesecurity:basic:enabled: falsemanagement:security:enabled: falseendpoints:actuator:enabled: true
好啦,我们改好重新启动应用,重新刷新Prometheus的页面http://localhost:9090/targets,就会很欣喜的看到没错了,正常了。
normal.png
要看有哪些指标可以现成使用的,可以在Graph菜单下,那个下拉列表中查找:
1508582902911.png
你可以选中一个指标,然后execute,就可以看到一个简陋的图表,显示指标的数据:

当然这个Prometheus自带的图表肯定不给力,这时就要请出Grafana了。
Grafana:
- 安装:
同样的进入官网http://docs.grafana.org/installation/windows/下载,请根据你的操作系统下载。解压进入bin目录,然后启动,访问http://localhost:3000你就会看到登录界面,默认的账户和密码都是admin。 - 配置:
add datasource,加上Prometheus的数据源配置。
1508583706422.png

接着我们新加入一个Dashboards:

1508583782500.png
新增一个Graph:
1508583850530.png
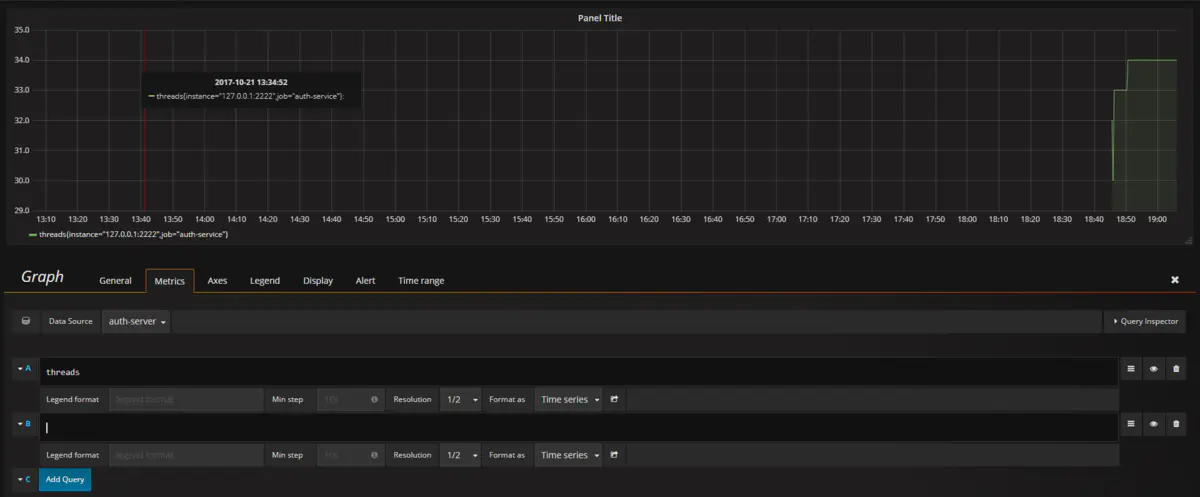
接着选择edit:
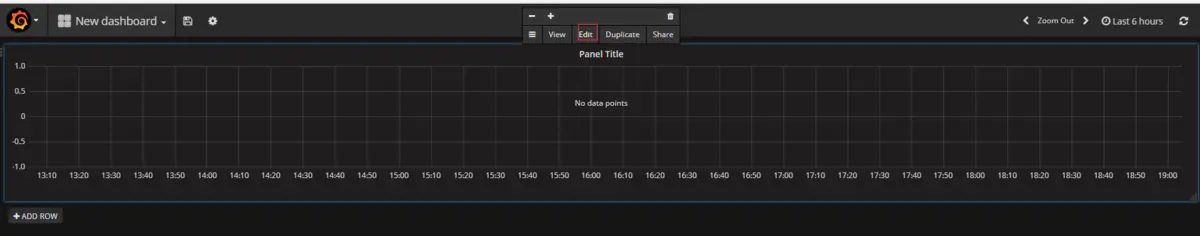
然后在metric中编辑数据源和指标,比如我们新增一个threads(线程数)的指标,完成后就可以看到美丽的图表了:
作者:FakeCoooode
链接:https://www.jianshu.com/p/9ec4f5f63932
来源:简书
著作权归作者所有。商业转载请联系作者获得授权,非商业转载请注明出处。

若有收获,就点个赞吧
0 人点赞
