R-waffle包简介
使用R绘制华夫饼图最简单的方法是使用waffle包进行绘制(当然,也可以使用ggplot2的geom_tile()和geom_point()函数绘制)。这里主要介绍waffle包waffle()、geom_pictogram()、geom_waffle()和scale_label_pictogram() 绘图函数,详细如下:
waffle():绘制方形华夫饼图geom_waffle():绘制方形华夫饼图图层(用法和ggplot2相似)geom_pictogram():绘制类似图形文字的集合图层。scale_label_pictogram():与geom_pictogram()一起使用,使用Font Awesome字体映射标签。
R-waffle包样例介绍
1、waffle():
基本例子:
library(tidyverse)library(ggtext)library(hrbrthemes)library(wesanderson)library(LaCroixColoR)library(RColorBrewer)library(waffle)parts <- data.frame(names = LETTERS[1:4],vals = c(80, 30, 20, 10))waffle_plot <- waffle(parts,rows = 8)+theme_ipsum(base_family = "Roboto Condensed",grid = "") +labs(title = "Example of <span style='color:#D20F26'>waffle::waffle() function</span>",subtitle = "processed charts with <span style='color:#1A73E8'>waffle()</span>",caption = "Visualization by <span style='color:#0057FF'>DataCharm</span>") +theme(plot.title = element_markdown(hjust = 0.5,vjust = .5,color = "black",size = 20, margin = margin(t = 1, b = 12)),plot.subtitle = element_markdown(hjust = 0,vjust = .5,size=15),plot.caption = element_markdown(face = 'bold',size = 12),axis.text.x = element_blank(),axis.text.y = element_blank())
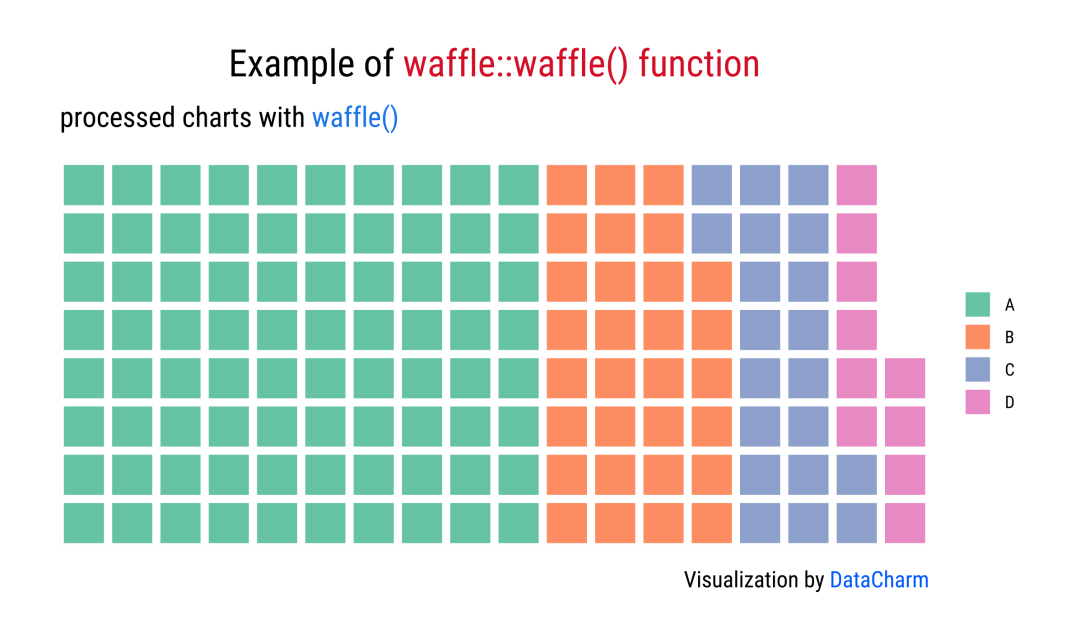
Example01 of waffle()
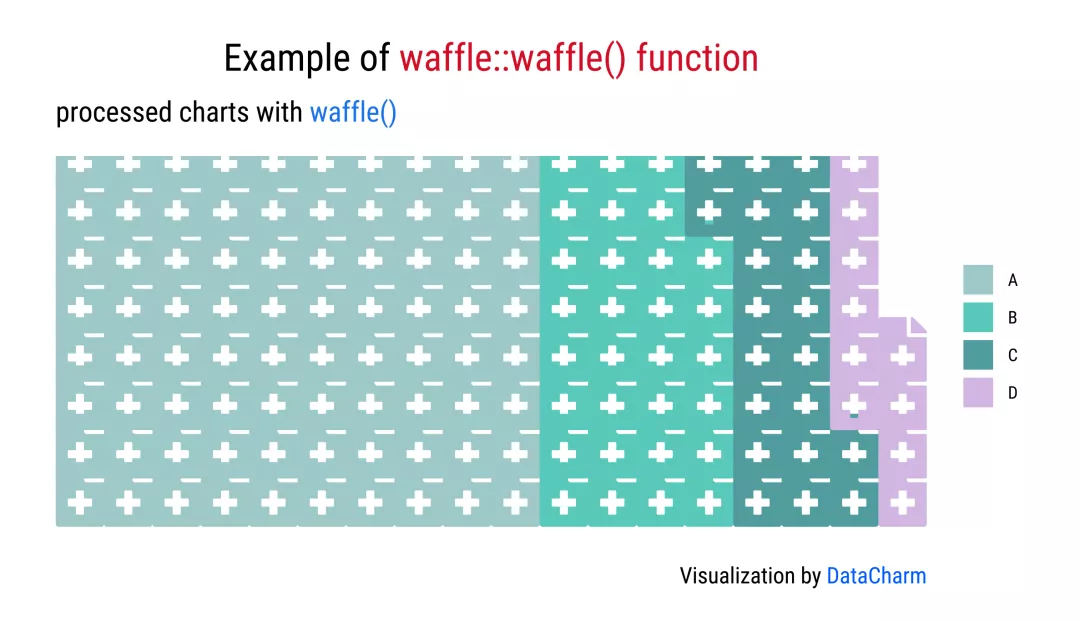
当然还可以通过设置use_glyph参数,使用fontawesome 图标进行绘制,如下:
waffle(parts,rows = 8,colors = c("#9DC8C8", "#58C9B9", "#519D9E","#D1B6E1"),use_glyph = "file-medical",size=5,legend_pos = "bottom")+····
2、geom_waffle():
df <- data.frame(parts = factor(rep(month.abb[1:3], 3), levels=month.abb[1:3]),vals = c(10, 20, 30, 6, 14, 40, 30, 20, 10))df_count <- df %>% count(parts, wt = vals)plot01 <- ggplot(data = df_count,aes(fill = parts, values = n)) +geom_waffle(n_rows = 20, size = .5, colour = "black", flip = TRUE) +#ggsci::scale_fill_lancet(labels = c("Fruit", "Sammich", "Pizza"))+scale_fill_manual(values = lacroix_palette(type = "paired"),labels = c("Fruit", "Sammich", "Pizza")) +guides(fill=guide_legend(nrow=1,byrow=TRUE,reverse = TRUE,title=NULL))+labs(title = "Example of <span style='color:#D20F26'>waffle::geom_waffle function</span>",subtitle = "processed charts with <span style='color:#1A73E8'>geom_waffle()</span>",caption = "Visualization by <span style='color:#0057FF'>DataCharm</span>") +theme_ipsum(base_family = "Roboto Condensed",grid="") +theme_enhance_waffle()+theme(plot.title = element_markdown(hjust = 0.5,vjust = .5,color = "black",size = 20, margin = margin(t = 1, b = 12)),plot.subtitle = element_markdown(hjust = 0,vjust = .5,size=15),plot.caption = element_markdown(face = 'bold',size = 12),legend.position = 'bottom',)
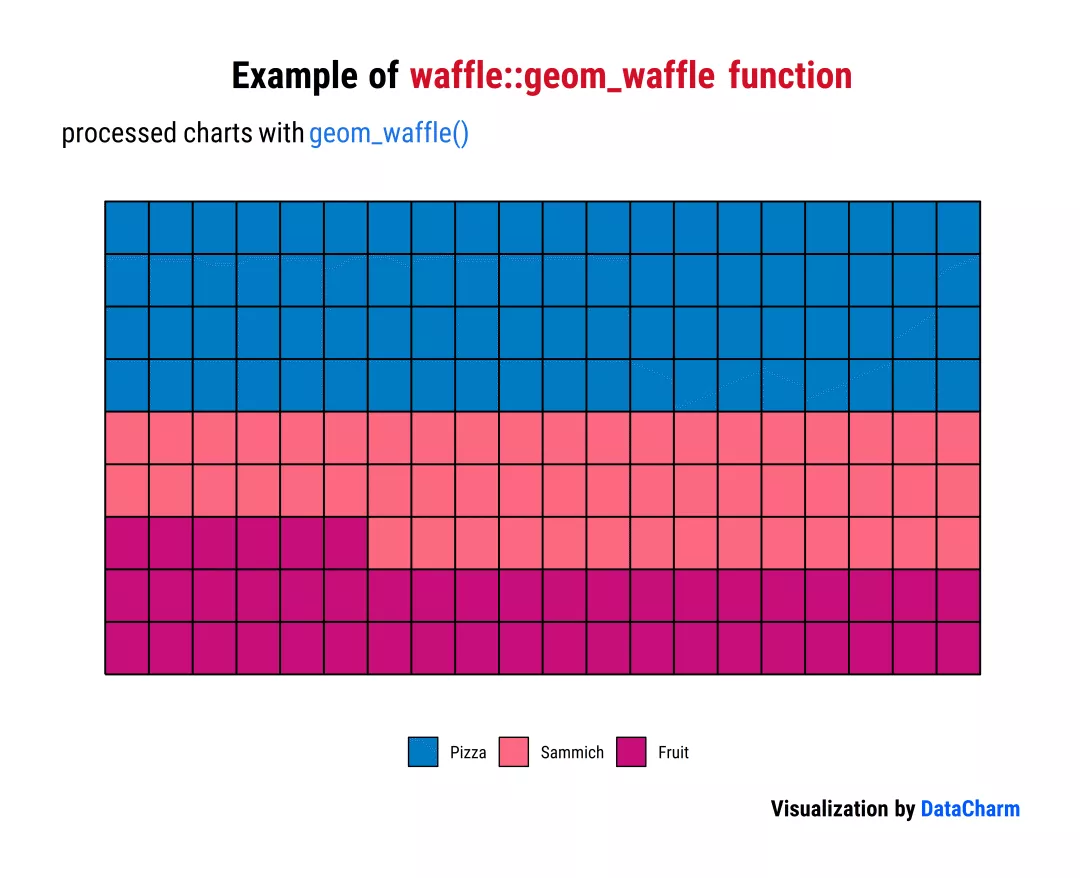
Example01 of geom_waffle
「Waffle Bar Charts」
test02 <- storms %>% filter(year >= 2010) %>% count(year, status)ggplot(test02, aes(fill = status, values = n)) +geom_waffle(color = "white", size = .25, n_rows = 10, flip = TRUE) +facet_wrap(~year, nrow = 1, strip.position = "bottom") +scale_x_discrete() +scale_y_continuous(labels = function(x) x * 10,expand = c(0,0)) +scale_fill_manual(values = lacroix_palette(type = "paired"),name=NULL) +coord_equal() +labs(title = "Example of <span style='color:#D20F26'>waffle::geom_pictogram function</span>",subtitle = "processed charts with <span style='color:#1A73E8'>geom_pictogram()</span>",caption = "Visualization by <span style='color:#0057FF'>DataCharm</span>",x = "Year",y = "Count") +theme_minimal(base_family = "Roboto Condensed") +theme(plot.title = element_markdown(hjust = 0.5,vjust = .5,color = "black",size = 20, margin = margin(t = 1, b = 12)),plot.subtitle = element_markdown(hjust = 0,vjust = .5,size=15),plot.caption = element_markdown(face = 'bold',size = 12),legend.position = 'bottom',panel.grid = element_blank(),axis.ticks.y = element_line()) +guides(fill = guide_legend(reverse = TRUE))

Example of geom_waffle()
通过此例子,就可以通过使用不同图方形个数表示不同类别的个数,当然,也可以使用不同样式图标进行表示。
3、geom_pictogram()和scale_label_pictogram()
还还可以通过geom_pictogram()、scale_label_pictogram()绘图函数使用fontawesome字体图标进行绘制,例子如下:
fa 字体.zip
#导入字体:比较重要的一步library(showtext)font_add(family = "FontAwesome5Free-Solid", regular = "E:\\Download Fonts\\fa-solid-900.ttf")font_add(family = "FontAwesome5Free-Regular", regular = "E:\\Download Fonts\\fa-regular-400.ttf")font_add(family = "FontAwesome5Brands-Regular", regular = "E:\\Download Fonts\\fa-brands-400.ttf")font_add(family = "Roboto Condensed",regular = "E:\\Download Fonts\\RobotoCondensed-Regular.ttf")plot02 <- ggplot(data = df_count) +geom_pictogram(aes(label = parts, values = n,colour = parts),n_rows = 10,flip = TRUE, make_proportional = TRUE) +scale_colour_manual(values = lacroix_palette(type = "paired"),labels = c("Fruit", "Sammich", "Pizza")) +scale_label_pictogram(values = c("apple-alt", "bread-slice", "pizza-slice"),labels = c("Fruit", "Sammich", "Pizza")) +guides(fill=guide_legend(nrow=1,byrow=TRUE,reverse = TRUE,title=NULL))+labs(title = "Example of <span style='color:#D20F26'>waffle::geom_pictogram() function</span>",subtitle = "processed charts with <span style='color:#1A73E8'>geom_pictogram()</span>",caption = "Visualization by <span style='color:#0057FF'>DataCharm</span>") +theme_ipsum(grid="") +theme_enhance_waffle()+theme(plot.title = element_markdown(hjust = 0.5,vjust = .5,color = "black",face = 'bold',size = 20, margin = margin(t = 1, b = 12)),plot.subtitle = element_markdown(hjust = 0,vjust = .5,size=15),plot.caption = element_markdown(face = 'bold',size = 12),legend.position = 'bottom',)
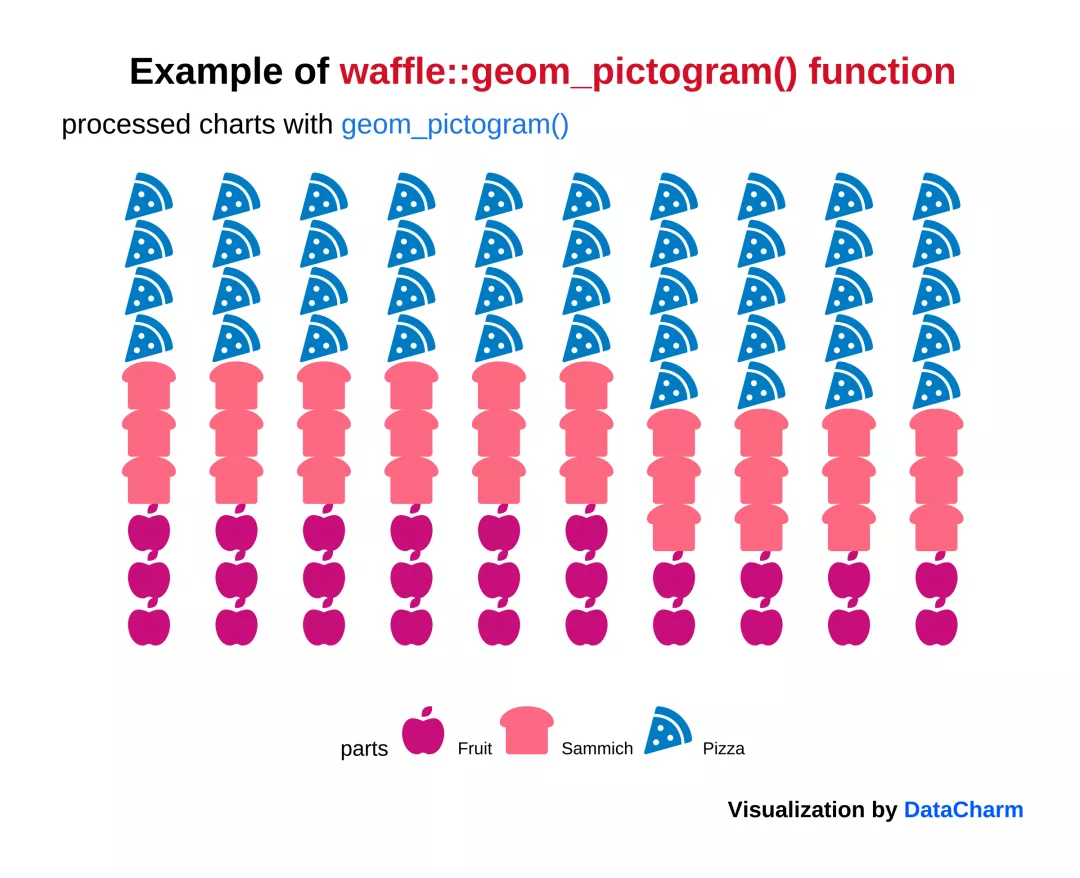
Example Of geom_pictogram

若有收获,就点个赞吧
0 人点赞
