主要的应用场景:结合监控服务实时进行监控,zabbix,nagios
官方链接:https://nginx.org/en/docs/http/ngx_http_stub_status_module.html
官方实例:
Example Configurationlocation = /basic_status {stub_status;}This configuration creates a simple web page with basic status data which may look like as follows:Active connections: 291server accepts handled requests16630948 16630948 31070465Reading: 6 Writing: 179 Waiting: 106
看实际配置
server {listen 8080; #指定监听哪个端口server_name www.test.com; #访问该服务通过哪个域名来访问root /html/game; #存放源码的目录index tndex.html; #定义首页文件location /admin {autoindex on;auth_basic "please input passwd";auth_basic_user_file /etc/nginx/conf.d/htpasswd;}location /status {stub_status;}}
展示内容解析:
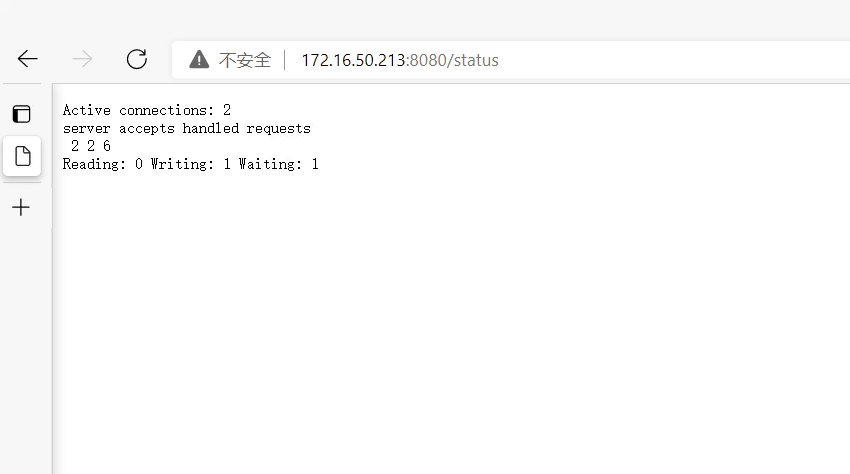
Active connections: 2 #当前nginx并发访问的连接数 当前活动客户端连接数,包括Waiting连接数。server #没啥用的字段accepts #接受的客户端连接总数。handled #处理的连接总数。通常,accepts 除非达到某些资源限制(例如,worker_connections限制),否则 该参数值是相同的。requests 客户端请求的总数。Reading: 0 # 正在读取的请求报文数量 这个值一般不超过worker进程数,如果超过的话 意味有请求是访问失败的 或者存在死链接占用进程Writing: 1 # 正在响应的请求Waiting: 1 # 队列中等待请求的数量 * 核心的数据 不能超过worker进程 出现等待意味着Nginx跑满了 还有许多请求在等待

若有收获,就点个赞吧
0 人点赞
